Scroll and Zoom
RadChartView provides zoom and scroll interactivity via the ChartPanAndZoomBehavior class. It is very simple to use and allows users to zoom in the chart plot area when there is a dense area of data points that can not be seen clearly at the normal chart scale. The scroll functionality allows moving the visible area of the chart.
In order to utilize this behavior users simply have to add it to the chart's Behaviors collection.
Example 1: Defining pan and zoom behavior
<telerikChart:RadCartesianChart.Behaviors>
   <telerikChart:ChartPanAndZoomBehavior />
</telerikChart:RadCartesianChart.Behaviors>
By default only the panning and zooming of the horizontal axis are enabled. You can alter this by setting the ZoomMode and PanMode properties of the ChartPanAndZoomBehavior. Both properties are of type ChartPanZoomMode and accept the following values:
- None: The zooming/panning with the mouse device is disabled. You can use this value to disable the zoom functionality of the behavior.
- Horizontal: The zooming/panning with the mouse device is enabled only on the horizontal axis.
- Vertical: The zooming/panning with the mouse device is enabled only on the vertical axis.
- Both: The zooming/panning with the mouse device is enabled both on the horizontal and vertical axes. You can use this value to removes any restrictions, thus the chart can be zoomed in both the horizontal and vertical axes.
The ZoomMode and PanMode properties can be used to restrict zooming/panning.
Example 2: Setting zoom mode
<telerikChart:RadCartesianChart.Behaviors>
   <telerikChart:ChartPanAndZoomBehavior ZoomMode="Both" />
</telerikChart:RadCartesianChart.Behaviors>
The ChartPanAndZoomBehavior works with the default axes. If the RadCartesianChart.HorizontalAxis is null, for example, the user will not be able to zoom or scroll horizontally, even though the individual series have horizontal axis (axes) defined.
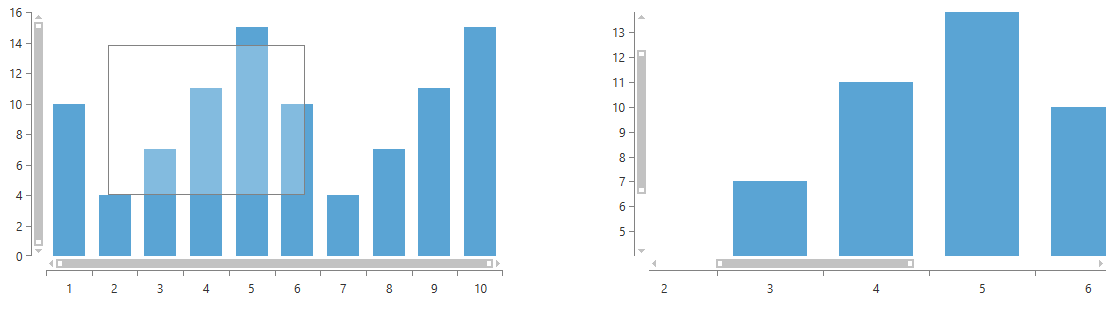
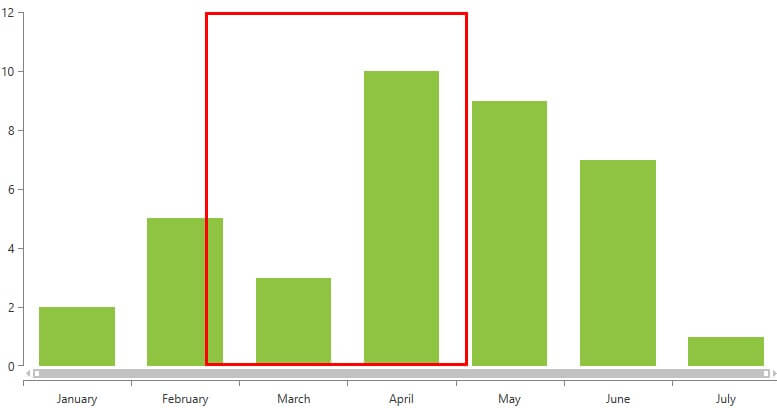
Drag to zoom/scroll
The pan and zoom behavior enables drag-to-zoom and drag-to-pan functionalities. By default, when the ChartPanAndZoomBehavior is activated and you start dragging on the plot area, a zoom rectangle will be created and when the mouse is released the visible area will fit into the rectangle.
Figure 1: Drag to zoom
You can alter the drag action using the DragMode property of the behavior. Setting it to Pan will start panning, instead of zooming when you drag the mouse over the plot area. To forbid any drag actions you can set the DragMode to None.
Example 3: Setting drag mode
<telerik:ChartPanAndZoomBehavior DragMode="Pan" />
You can also specify the minimum distance between the start and end points of the drag operation that will allow the drag-to-zoom/pan action to be activated. This is controlled by the DragToZoomThreshold property.
Example 4: Setting minimum drag-to-zoom distance
<telerik:ChartPanAndZoomBehavior DragToZoomThreshold="100" />
The ChartPanAndZoomBehavior allows you to define custom key combinations that activate the panning and zooming. You can do this using the DragToZoomKeyCombinations and DragToPanKeyCombinations collections.
Example 5: Setting the left Ctrl key + mouse right button down as a combination that activates the zooming
var keyCombo = new ChartKeyCombination();
keyCombo.Keys.Add(Key.LeftCtrl);
keyCombo.MouseButtons.Add(MouseButton.Right);

panAndZoomBehavior.DragToZoomKeyCombinations.Add(keyCombo);
Example 6: Setting the mouse right button down as a trigger that activates the panning
var keyCombo = new ChartKeyCombination();
keyCombo.MouseButtons.Add(MouseButton.Right);

panAndZoomBehavior.DragToPanKeyCombinations.Add(keyCombo);
The DragToZoomKeyCombinations and DragToPanKeyCombinations properties have higher priority than the DragMode property and if any combination is satisfied, a drag/pan-to-zoom operation is started.
To cancel the drag to zoom operation you can use the CancelDragToZoom() method of the behavior.
Example 7: Canceling drag to zoom
panAndZoomBehavior.CancelDragToZoom();
Manual scroll and zoom
The chart control has several properties which can be used to manually control the panning and zooming.
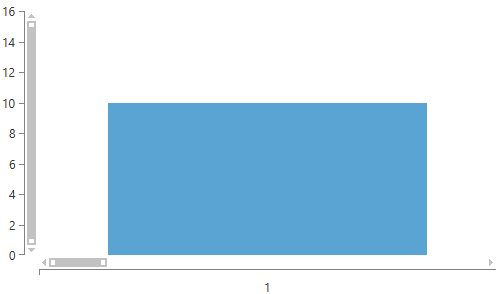
The Zoom property allows you to set the scale level for both axes. For example a Zoom=new Size(10,1) setting specifies that the data will be zoomed 10 times according to the horizontal axis and won't be zoomed by the vertical axis.
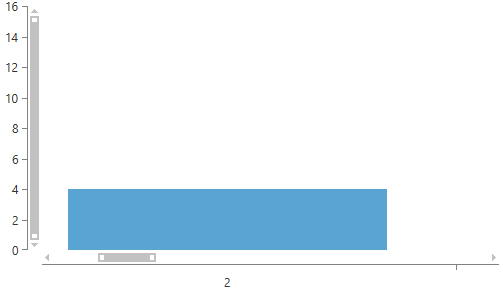
With the PanOffset you can specify the visible area of the chart. Note that PanOffset works with negative absolute values. For example, PanOffset=new Point(-500,0) will offset the visible area at 500px.
Example 8: Setting zoom
<telerik:RadCartesianChart Zoom="10,1">
    <telerik:RadCartesianChart.HorizontalAxis>
        <telerik:CategoricalAxis/>
    </telerik:RadCartesianChart.HorizontalAxis>
    <telerik:RadCartesianChart.VerticalAxis>
        <telerik:LinearAxis/>
    </telerik:RadCartesianChart.VerticalAxis>
    <telerik:RadCartesianChart.Behaviors>
        <telerik:ChartPanAndZoomBehavior ZoomMode="Both">
        </telerik:ChartPanAndZoomBehavior>
    </telerik:RadCartesianChart.Behaviors>
    <telerik:RadCartesianChart.Series>
        <telerik:BarSeries>
            <telerik:BarSeries.DataPoints>
                <telerik:CategoricalDataPoint Category="1" Value="10" />
                <telerik:CategoricalDataPoint Category="2" Value="4" />
                <telerik:CategoricalDataPoint Category="3" Value="7" />
                <telerik:CategoricalDataPoint Category="4" Value="11" />
                <telerik:CategoricalDataPoint Category="5" Value="15" />
                <telerik:CategoricalDataPoint Category="6" Value="10" />
                <telerik:CategoricalDataPoint Category="7" Value="4" />
                <telerik:CategoricalDataPoint Category="8" Value="7" />
                <telerik:CategoricalDataPoint Category="9" Value="11" />
                <telerik:CategoricalDataPoint Category="10" Value="15" />
            </telerik:BarSeries.DataPoints>
        </telerik:BarSeries>
    </telerik:RadCartesianChart.Series>
</telerik:RadCartesianChart>
Figure 2: Zoom-in chart
Note that the setting the PanOffset in XAML or the constructor of the view that holds the chart won't be respected. This is because the property uses the chart's size which is not yet calculated at this point. In order to apply the offset you can set it after the chart is loaded.
Example 9: Setting pan offset in code
private void RadCartesianChart_Loaded(object sender, RoutedEventArgs e)
{
    var chart = (RadCartesianChart)sender;
    chart.PanOffset = new Point(-500, 0);
}
Figure 3: Offset visible area
The chart also provides few properties that combines the behaviors of Zoom and PanOffset.
- HorizontalZoomRangeStart and HorizontalZoomRangeEnd
- VerticalZoomRangeStart and VerticalZoomRangeEnd
Those properties controls the visible are of the chart by defining the start and end positions of the scrollbar of the corresponding axis. The properties work in relative units between 0 and 1. So if the start of the plot area is at 0, the end it will be at 1, and the center at 0.5. Having this in mind we can construct the same view as the one demonstrated in Figure 3 but using the zoom range properties.
Example 10: Using zoom range properties
<telerik:RadCartesianChart HorizontalZoomRangeStart="0.1" HorizontalZoomRangeEnd="0.2">
    <telerik:RadCartesianChart.HorizontalAxis>
        <telerik:CategoricalAxis/>
    </telerik:RadCartesianChart.HorizontalAxis>
    <telerik:RadCartesianChart.VerticalAxis>
        <telerik:LinearAxis/>
    </telerik:RadCartesianChart.VerticalAxis>
    <telerik:RadCartesianChart.Behaviors>
        <telerik:ChartPanAndZoomBehavior ZoomMode="Both">
        </telerik:ChartPanAndZoomBehavior>
    </telerik:RadCartesianChart.Behaviors>
    <telerik:RadCartesianChart.Series>
        <telerik:BarSeries>
            <telerik:BarSeries.DataPoints>
                <telerik:CategoricalDataPoint Category="1" Value="10" />
                <telerik:CategoricalDataPoint Category="2" Value="4" />
                <telerik:CategoricalDataPoint Category="3" Value="7" />
                <telerik:CategoricalDataPoint Category="4" Value="11" />
                <telerik:CategoricalDataPoint Category="5" Value="15" />
                <telerik:CategoricalDataPoint Category="6" Value="10" />
                <telerik:CategoricalDataPoint Category="7" Value="4" />
                <telerik:CategoricalDataPoint Category="8" Value="7" />
                <telerik:CategoricalDataPoint Category="9" Value="11" />
                <telerik:CategoricalDataPoint Category="10" Value="15" />
            </telerik:BarSeries.DataPoints>
        </telerik:BarSeries>
    </telerik:RadCartesianChart.Series>
</telerik:RadCartesianChart>
Mouse wheel mode
You can use the MouseWheelMode property of ChartPanAndZoomBehavior to specify how the chart will respond to mouse wheel. The property value is an enumeration that accepts the following values:
- Default: The mouse wheel action will zoom the chart in respect to the ZoomMode property.
- None: The mouse wheel action won't be respected. Nothing will happen.
- Zoom: The mouse wheel action will zoom the chart both horizontally and vertically.
- ZoomHorizontally and ZoomVertically: The mouse wheel action will zoom the chart horizontally/vertically.
- PanHorizontally and PanVertically: The mouse wheel action will pan the chart horizontally/vertically.
Example 11: Settings mouse wheel mode
<telerik:ChartPanAndZoomBehavior MouseWheelMode="Zoom" />
Restrict zooming
To restrict the zooming you can set the MinZoom and MaxZoom properties of the chart. This defines a minimum and maximum scale values for chart axes. For example a MaxZoom=new Size(50, 15) setting specifies that the maximum zoom level on the horizontal axis is 50, and the maximum zoom level on the vertical axis is 15.
Example 12: Restrict zooming
  <telerik:RadCartesianChart MaxZoom="30, 30" MinZoom="5, 5">
    <telerik:RadCartesianChart.HorizontalAxis>
        <telerik:CategoricalAxis/>
    </telerik:RadCartesianChart.HorizontalAxis>
    <telerik:RadCartesianChart.VerticalAxis>
        <telerik:LinearAxis/>
    </telerik:RadCartesianChart.VerticalAxis>
    <telerik:RadCartesianChart.Behaviors>
        <telerik:ChartPanAndZoomBehavior ZoomMode="Both" />
    </telerik:RadCartesianChart.Behaviors>
    <telerik:RadCartesianChart.Series>
        <telerik:BarSeries>
            <telerik:BarSeries.DataPoints>
                <telerik:CategoricalDataPoint Category="1" Value="18" />
                <telerik:CategoricalDataPoint Category="2" Value="4" />
                <telerik:CategoricalDataPoint Category="3" Value="7" />
                <telerik:CategoricalDataPoint Category="4" Value="11" />
                <telerik:CategoricalDataPoint Category="5" Value="15" />
                <telerik:CategoricalDataPoint Category="6" Value="10" />
                <telerik:CategoricalDataPoint Category="7" Value="4" />
                <telerik:CategoricalDataPoint Category="8" Value="7" />
                <telerik:CategoricalDataPoint Category="9" Value="11" />
                <telerik:CategoricalDataPoint Category="10" Value="15" />
            </telerik:BarSeries.DataPoints>
        </telerik:BarSeries>
    </telerik:RadCartesianChart.Series>
</telerik:RadCartesianChart>
Style the PanZoomBar
You can use the PanZoomBarStyle property in order to stylize the PanZoomBar. The applied style is individual for each axis.
Example 13: Style the PanZoomBar on the VerticalAxis
<telerik:RadCartesianChart.VerticalAxis>
    <telerik:LinearAxis>
        <telerik:LinearAxis.PanZoomBarStyle>
            <Style TargetType="telerik:PanZoomBar">
                <Setter Property="Background" Value="GreenYellow"/>
            </Style>
        </telerik:LinearAxis.PanZoomBarStyle>
    </telerik:LinearAxis>
</telerik:RadCartesianChart.VerticalAxis>
Figure 4: Stylized PanZoomBar on the VerticalAxis
Style Drag Zoom Border
You can use the DragZoomBorderStyle property of the RadCartesianChart in order to stylize the DragZoomBorder element. The applied style needs to target the Border element.
Example 14: Style the Drag Zoom Border
<telerik:RadCartesianChart.DragZoomBorderStyle>
    <Style TargetType="Border">
        <Setter Property="BorderThickness" Value="3"/>
        <Setter Property="BorderBrush" Value="Red"/>
    </Style>
</telerik:RadCartesianChart.DragZoomBorderStyle>
Figure 5: Stylized Drag Zoom Border
Separate Axis Zooming and Panning
The Cartesian chart allows you to define separate axis for each chart series, thus displaying multiple axes. The pan/zoom related properties of the chart and the ChartPanAndZoomBehavior are zooming all axes simultaneously. To enable individual zooming/panning per axis, you can use the AxisPanAndZoomExtensions static class and its attached properties. The properties are used with a chart axis instance (like LinearAxis, CategoricalAxis, etc.).
To display a PanZoomBar for a series axis, set the AxisPanAndZoomExtensions.EnablePanAndZoom attached property.
The pan zoom can be adjusted manually using the Zoom, MaxZoom, MinZoom, MaxZoom, ZoomRangeStart and ZoomRangeEnd properties of the AxisPanAndZoomExtensions class. These work the same as the chart zoom/pan properties described previously in this article.
Example 15: Showing pan zoom bar for the separate series axes
<telerik:RadCartesianChart>
    <telerik:RadCartesianChart.HorizontalAxis>
        <telerik:CategoricalAxis />
    </telerik:RadCartesianChart.HorizontalAxis>
    <telerik:RadCartesianChart.Series>
        <telerik:LineSeries Stroke="#E84033">
            <telerik:LineSeries.DataPoints>
                <telerik:CategoricalDataPoint Category="A" Value="10" />
                <telerik:CategoricalDataPoint Category="B" Value="5" />
                <telerik:CategoricalDataPoint Category="C" Value="10" />
                <telerik:CategoricalDataPoint Category="D" Value="5" />
                <telerik:CategoricalDataPoint Category="E" Value="10" />
            </telerik:LineSeries.DataPoints>
            <telerik:LineSeries.VerticalAxis>
                <telerik:LinearAxis ElementBrush="#E84033"
                                    telerik:AxisPanAndZoomExtensions.EnablePanAndZoom="True"
                                    telerik:AxisPanAndZoomExtensions.ZoomRangeStart="0.2"
                                    telerik:AxisPanAndZoomExtensions.ZoomRangeEnd="0.8"/>
            </telerik:LineSeries.VerticalAxis>
        </telerik:LineSeries>
        <telerik:LineSeries Stroke="#299B48">
            <telerik:LineSeries.DataPoints>
                <telerik:CategoricalDataPoint Category="A" Value="5" />
                <telerik:CategoricalDataPoint Category="B" Value="10" />
                <telerik:CategoricalDataPoint Category="C" Value="5" />
                <telerik:CategoricalDataPoint Category="D" Value="10" />
                <telerik:CategoricalDataPoint Category="E" Value="5" />
            </telerik:LineSeries.DataPoints>
            <telerik:LineSeries.VerticalAxis>
                <telerik:LinearAxis ElementBrush="#299B48" HorizontalLocation="Right"
                                    telerik:AxisPanAndZoomExtensions.EnablePanAndZoom="True"
                                    telerik:AxisPanAndZoomExtensions.ZoomRangeStart="0.4"
                                    telerik:AxisPanAndZoomExtensions.ZoomRangeEnd="1"/>
            </telerik:LineSeries.VerticalAxis>
        </telerik:LineSeries>
    </telerik:RadCartesianChart.Series>
</telerik:RadCartesianChart>
Figure 6: Series axes with individual PanZoomBars
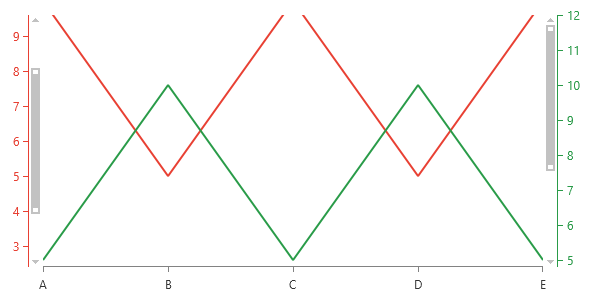
In case the ChartPanAndZoomBehavior is enabled the zooming/pan is applied to the main axes of the chart (assigned to the VerticalAxis and HorizontalAxis of RadCartesianChart). When you scroll the mouse wheel or use PanZoomBars of the main axes, the new zoom range is synchronized with the other (series) axes.