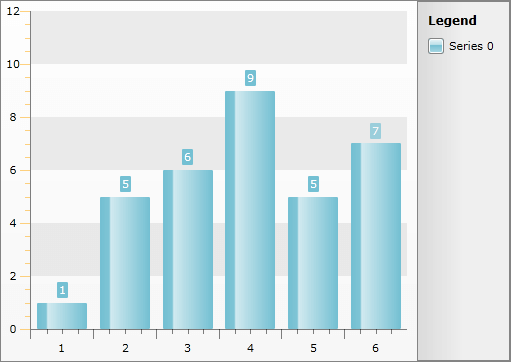
Styling the Axis Minor Tick
The axis minor tick lines are part of the chart axis and are represented by the Line control. To create a style for them in Expression Blend use a dummy control and after modifying it, set it to the AxisStyles complex property of the Axis.
Open your RadChart project in Expression Blend. To add the dummy Line control you have to go to the XAML view. To do that select View -> Active Document View -> XAML View from the menu. Declare a Line control in your XAML.
<Grid x:Name="LayoutRoot" Background="White">
    <!--...-->
    <Line />
</Grid>
To go back to the design view select View -> Active Document View -> Design View from the menu. In the 'Objects and Timeline' pane select the newly created Line control. And select Object -> Edit Style -> Create Empty from the menu*. *You will be prompted for the name of the style and where to be placed within your application.
If you choose to define the style in Application, it would be available for the entire application. This allows you to define a style only once and then reuse it where needed.
After clicking the OK button, a style with target type Line will be created and the properties for this type will be loaded in the 'Properties' pane. Modify them until you get the desired appearance.
Changing the StrokeThickness won't change anything, because of a modification to the Axis template that prevents line blurriness.
After finishing with the changes, it is time to set the style to the MinorTickLineStyle property. It can be set only through the procedural code, which means that you have to go to the Visual Studio and modify the code-behind file of your UserControl.
this.radChart.DefaultView.ChartArea.AxisY.AxisStyles.MinorTickLineStyle = this.Resources["AxisYMinorTickStyle"] as Style;
this.radChart.DefaultView.ChartArea.AxisY.AxisStyles.TickLineStyle = this.Resources["AxisYTickStyle"] as Style;
Me.RadChart.DefaultView.ChartArea.AxisY.AxisStyles.MinorTickLineStyle = TryCast(Me.Resources("AxisYMinorTickStyle"), Style)
Me.RadChart.DefaultView.ChartArea.AxisY.AxisStyles.TickLineStyle = TryCast(Me.Resources("AxisYTickStyle"), Style)
Setting the styles for the y-axis is done analogically via the AxisY property of the ChartArea.
To learn how to style the primary ticks take a look at the Styling the Axis Tick topic.
Here is the final XAML for the Styles:
<Style x:Key="AxisYMinorTickStyle" TargetType="Line">
    <Setter Property="Stroke" Value="Orange" />
</Style>
<Style x:Key="AxisYTickStyle" TargetType="Line">
    <Setter Property="Stroke" Value="Orange" />
</Style>
