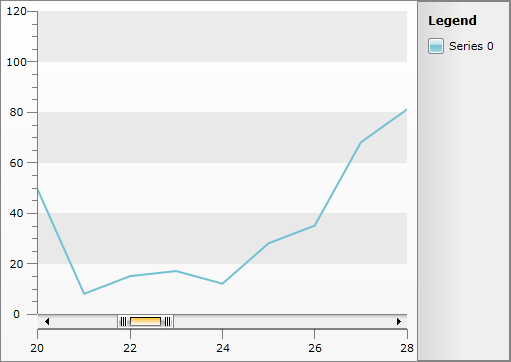
Zooming and Scrolling
This feature is available in data bound scenarios only! Additional requirement is an ItemMapping with DataPointMember set to XValue or XCategory.
Sometimes, when having a large sets of data, they are hard to visualize, because the points to be rendered are far more than the space available for the RadChart. In this case you can use the Sampling feature of the RadChart.
Implementing Zooming and Scrolling
Besides the Sampling, the RadChart provides you with Zooming and Scrolling, which additionally help handling large sets of data. The API that implements these two features is encapsulated in the ZoomScrollingSettings class. It exposes the following properties:
Consider the range of the data as logical values between 0 and 1. For example, if the data has consecutive values from 0 to 100, the 0.2 to 0.3 logical range will match the values between 20 and 30.
MinZoomRange - specifies the minimal range that can be visible in the ChartArea. For example, a minimal range of 0.1 will display 10% of the whole series (the series will get zoomed 10x).
RangeStart - specifies the start of the range that will get displayed in the ChartArea. For example, if you set it to 0.5 the data displayed in the ChartArea will start from the middle of the set.
RangeEnd - specifies the end of the range that will get displayed in the ChartArea. For example, if you set it to 0.5 the data displayed in the ChartArea will end in the middle of the set.
Range - it is a read only property, that returns the difference between the RangeEnd and the RangeStart.
ScrollMode - determines the mode of the scrolling and has the following values:
None - neither zoom, nor scrolling are enabled.
ScrollAndZoom - both zoom and scrolling are enabled.
ScrollOnly - only scrolling is enabled.
The ZoomScrollingSetting exposes a PropertyChanged event which allows you to execute your custom logic, when a certain property has changed.
To apply the ZoomScrollingSettings you have to set them to the ZoomScrollingSettingsX and/or the ZoomScrollingSettingsY of the ChartArea.
Combining the Zooming feature with the Sampling feature can be very useful.
Here is an example.
this.radChart.DefaultView.ChartArea.ZoomScrollSettingsX.MinZoomRange = 0.1;
this.radChart.DefaultView.ChartArea.ZoomScrollSettingsX.RangeEnd = 0.3;
this.radChart.DefaultView.ChartArea.ZoomScrollSettingsX.RangeStart = 0.2;
this.radChart.DefaultView.ChartArea.ZoomScrollSettingsX.ScrollMode = ScrollMode.ScrollAndZoom;
Me.radChart.DefaultView.ChartArea.ZoomScrollSettingsX.MinZoomRange = 0.1
Me.radChart.DefaultView.ChartArea.ZoomScrollSettingsX.RangeEnd = 0.3
Me.radChart.DefaultView.ChartArea.ZoomScrollSettingsX.RangeStart = 0.2
Me.radChart.DefaultView.ChartArea.ZoomScrollSettingsX.ScrollMode = ScrollMode.ScrollAndZoom

Using the Zooming and Scrolling
There are two things the user can do in order to zoom the series in the ChartArea:
-
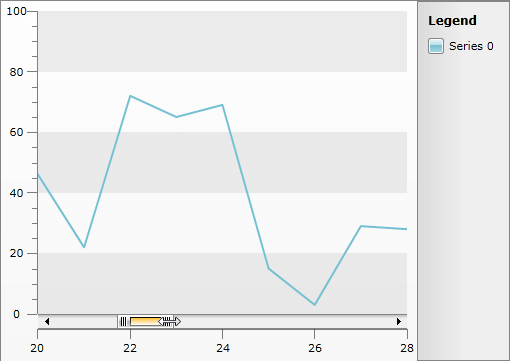
Resize the ScrollBar - the ScrollBar can be resized from both the left and the right side. Changing its size, changes the range of the displayed data.

-
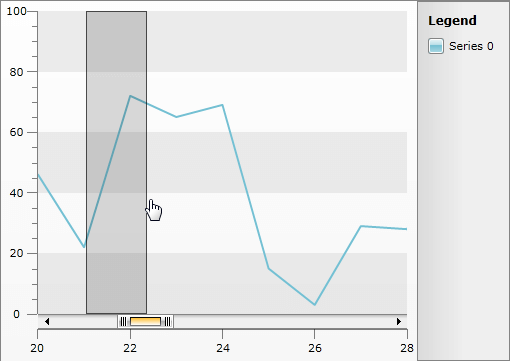
Select an Area - you can draw a selection on the ChartArea, which will determine the range of data to be displayed.

Styling the Zooming and Scrolling Elements
In order to style the Zooming and Scrolling elements you can use the DragZoomLayerControlStyle and the DragZoomSelectionStyle properties of the ChartArea.