Sampling
Sampling is available in data binding scenarios only. Sampling is also not applicable when plotting data for properties of non-CLS compliant types, like uint.
When the chart is populated by thousands of items, the visual representation might not be that clear. It is possible that there are two or more DataPoints shown with a very close Y and X values. This is when sampling comes in handy. The chart combines the items, so that the DataPoints are limited to a certain number (200 by default). The sampling engine does not detect/determine whether the datapoints will be on similar pixel coordinates. Instead, it visualizes a subset of the original data. For example, if you have 1000 points, 95% of which are clustered together, and you choose a sampling threshold of 300 points, 95% of these 300 points will be clustered as well. In such a scenario, one possible option is to use Zooming and Scrolling.
Determining the number of DataPoints to be displayed is done by setting the SamplingTh reshold property of the SamplingSettings:
<telerik:RadChart x:Name="radChart">
    <telerik:RadChart.SamplingSettings>
        <telerik:SamplingSettings SamplingThreshold="100" />
    </telerik:RadChart.SamplingSettings>
</telerik:RadChart>
Set the SamplingThreshold to 0 to disable the feature.
The way in which RadChart combines the DataPoints depends on the value of the SamplingFunction property of the SamplingSettings.
When binding without series mappings, the value of the RadChart.SamplingSettings.SamplingFunction determines the pattern. When binding with series mappings, the value of the pattern is determined by the value of the ItemMapping.SamplingFunction.
The SamplingFunction property has the following values.
Average - takes the average value of the sampled points.
KeepExtremes - shows the minimum or the maximum point. The one that is farthest from the sample average is shown.
Min - shows the minimum point.
Max - shows the maximum point.
Sum - shows the sum point of the points.
First - shows the point with the smallest index in the series area that is to be sampled.
Last - shows the point with the highest index in the series area that is to be sampled.
Here is an example:
<telerik:RadChart x:Name="radChart">
    <telerik:RadChart.SamplingSettings>
        <telerik:SamplingSettings SamplingFunction="Average"
                                  SamplingThreshold="100" />
</telerik:RadChart.SamplingSettings>
k:RadChart>
Custom Sampling Functions
Custom sampling functions are implemented in the same manner as GridView's custom aggregating functions.
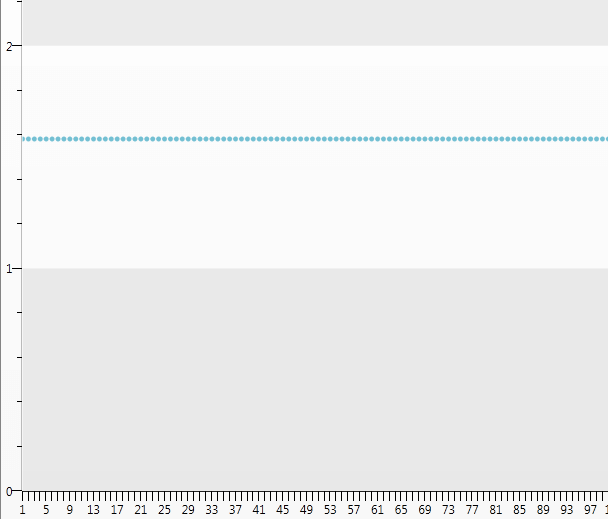
The following sample code will demonstrate how to create a standard deviation function for the Range of numbers 0 - 1000 and creates ScatterSeriesDefinition with the result from this function.
The standard deviation is calculated as follows:
Calculate the average of the values.
Subtract each value from the average.
Take the result to the second power.
Sum-up the result of steps 1-3 over all of the values.
Divides the sum by the number of values.
Takes the square root of the result.
These steps are made by the static class Statistics:
public static class Statistics
{
    public static double StdDev<TSource>(IEnumerable<TSource> source, Func<TSource, MyClass> selector)
    {
        return StdDev<TSource, MyClass>(source, selector);
    }

    public static double StdDev<TSource, TResult>(IEnumerable<TSource> source, Func<TSource, TResult> selector)
        where TResult : MyClass
    {
        int itemCount = source.Count();
        if (itemCount > 1)
        {
            IEnumerable<double> values = from i in source select Convert.ToDouble(selector(i).Y);

            double sum = SumAvg(values);

            return Math.Sqrt(sum / (itemCount - 1));
        }

        return 0;
    }

    private static double SumAvg(IEnumerable<double> values)
    {
        double average = values.Average();
        double sum = 0;

        foreach (double item in values)
        {
            sum += Math.Pow(item - average, 2);
        }

        return sum;
    }
}
Public NotInheritable Class Statistics
    Private Sub New()
    End Sub
    Public Shared Function StdDev(Of TSource)(ByVal source As IEnumerable(Of TSource), ByVal selector As Func(Of TSource, [MyClass])) As Double
        Return StdDev(Of TSource, [MyClass])(source, selector)
    End Function

    Public Shared Function StdDev(Of TSource, TResult As [MyClass])(ByVal source As IEnumerable(Of TSource), ByVal selector As Func(Of TSource, TResult)) As Double
        Dim itemCount As Integer = source.Count()
        If itemCount > 1 Then
            Dim values As IEnumerable(Of Double) = From i In source
                                                   Select Convert.ToDouble(selector(i).Y)

            Dim sum As Double = SumAvg(values)

            Return Math.Sqrt(sum / (itemCount - 1))
        End If

        Return 0
    End Function

    Private Shared Function SumAvg(ByVal values As IEnumerable(Of Double)) As Double
        Dim average As Double = values.Average()
        Dim sum As Double = 0

        For Each item As Double In values
            sum += Math.Pow(item - average, 2)
        Next item

        Return sum
    End Function
End Class
The real standard deviation function inherits Telerik.Windows.Data.EnumerableSelectorAggregateFunction class that uses aggregate extension methods provided in System.Linq.Enumerable:
public class StandardDeviationFunction : EnumerableSelectorAggregateFunction
{
    protected override string AggregateMethodName
    {
        get
        {
            return "StdDev";
        }
    }

    protected override Type ExtensionMethodsType
    {
        get
        {
            return typeof(Statistics);
        }
    }
}
Public Class StandardDeviationFunction
    Inherits EnumerableSelectorAggregateFunction
    Protected Overrides ReadOnly Property AggregateMethodName() As String
        Get
            Return "StdDev"
        End Get
    End Property

    Protected Overrides ReadOnly Property ExtensionMethodsType() As Type
        Get
            Return GetType(Statistics)
        End Get
    End Property
End Class
The Chart itself is populated by List of Business Object:
public Sample ()
{
    InitializeComponent();
    radChart.DefaultView.ChartArea.AxisX.LabelStep = 4;
    List<MyClass> data = new List<MyClass>();

    for (int i = 0; i < 1000; i++)
    {
        data.Add(new MyClass()
        {
            Y  = i
        });
    }

    radChart.ItemsSource = data;
        }

public class MyClass
{
    public double Y { get; set; }
}
Private Sub New()
    InitializeComponent()
    RadChar1.DefaultView.ChartArea.AxisX.LabelStep = 4
    Dim data As New List(Of [MyClass])()
    For i As Integer = 0 To 999
        data.Add(New MyClass With {.Y = i})
    Next i
    RadChar1.ItemsSource = data
End Sub

Public Class [MyClass]
    Public Property Y() As Double
End Class
The LabelStep of the AxisX is set to 4 for better readability.
Finally the XAML:
<telerik:RadChart Name="RadChar1">
            <telerik:RadChart.DefaultSeriesDefinition>
                <telerik:ScatterSeriesDefinition ShowItemLabels="False" ShowItemToolTips="False" />
            </telerik:RadChart.DefaultSeriesDefinition>
            <telerik:RadChart.SeriesMappings>
                <telerik:SeriesMapping>
                    <telerik:SeriesMapping.ItemMappings>
                        <telerik:ItemMapping DataPointMember="YValue" FieldName="Y">
                            <telerik:ItemMapping.CustomSamplingFunction>
                                <local:StandardDeviationFunction />
                            </telerik:ItemMapping.CustomSamplingFunction>
                        </telerik:ItemMapping>
                    </telerik:SeriesMapping.ItemMappings>
                </telerik:SeriesMapping>
            </telerik:RadChart.SeriesMappings>
        </telerik:RadChart>
The result:
