Display country data using GeoJSON
Environment
| Product | Telerik WebForms Map for ASP.NET AJAX |
Description
In this article you will learn how to display country specific data, using GeoJSON.

Solution
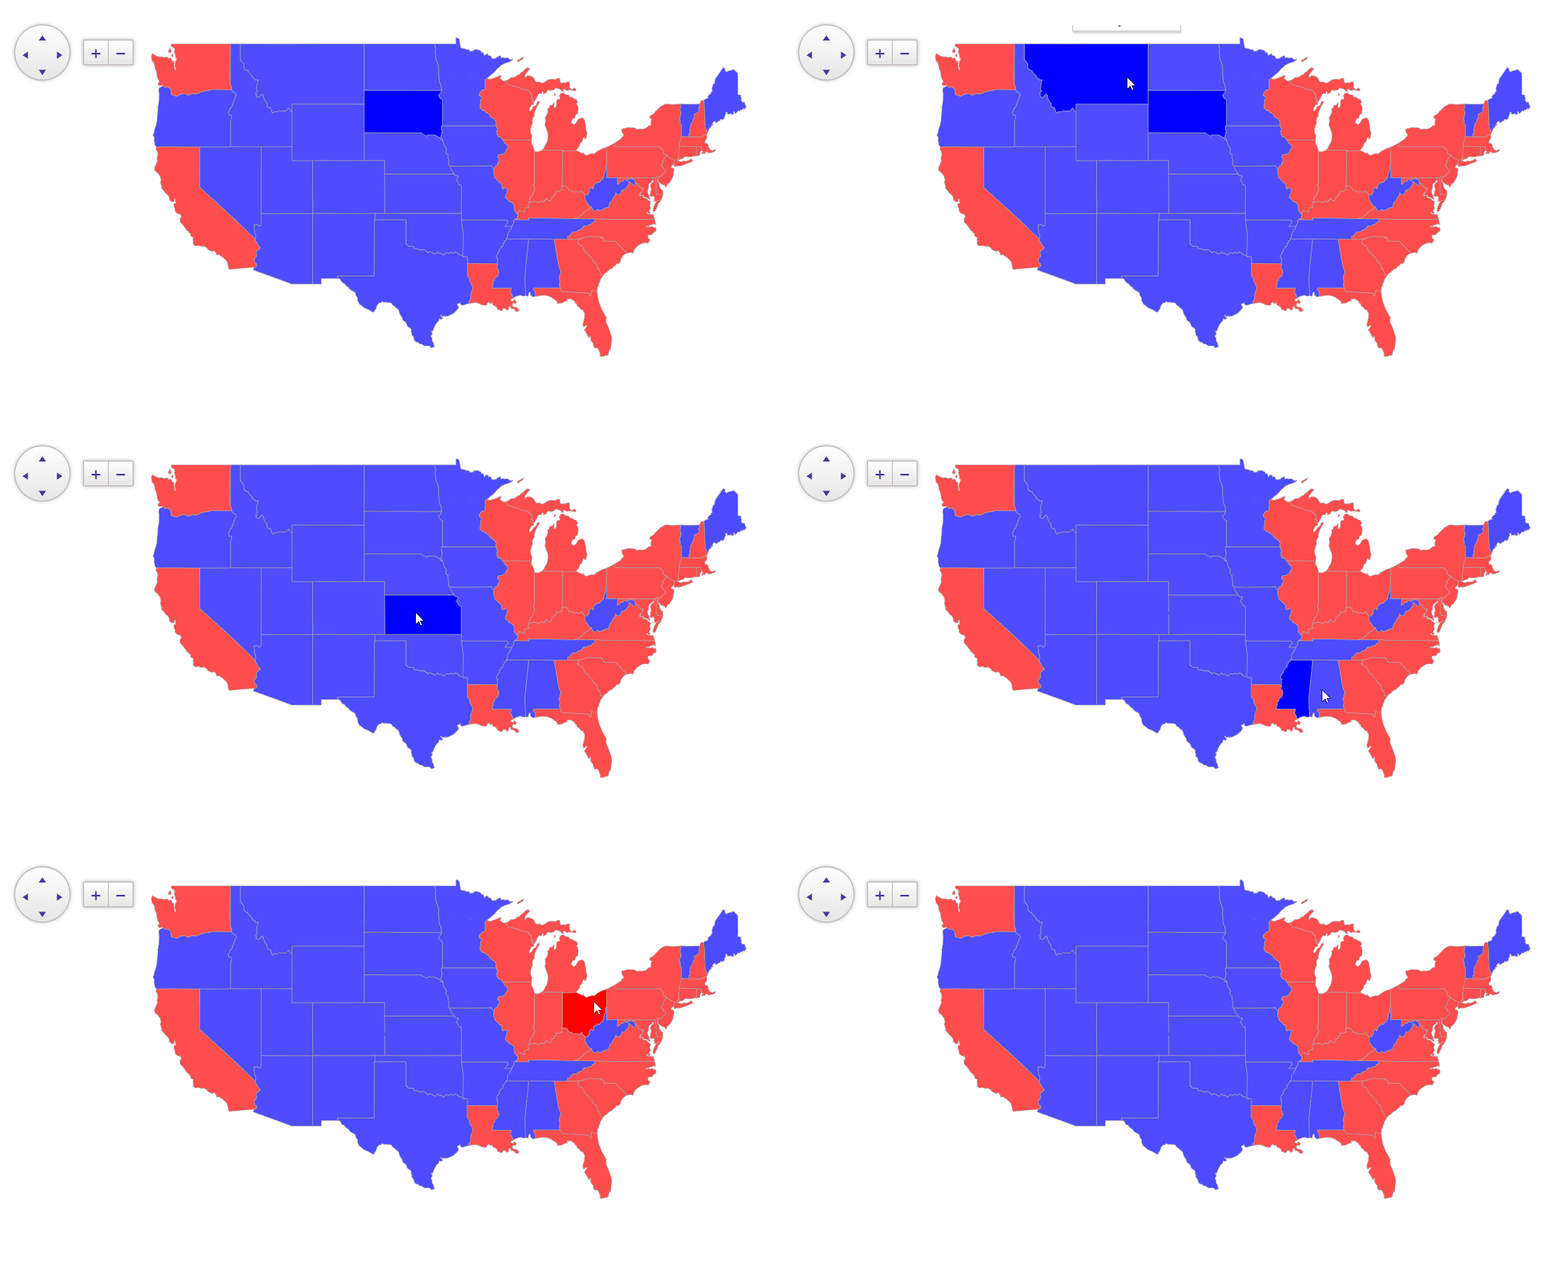
The following example demonstrates the density of the USA per state, with the assosciated GeoJSON data. For this scenario, we're binding the GeoJSON to the Map by using the RadClientDataSource:
<telerik:RadMap ID="RadMap1" runat="server" Zoom="3" LayersDataSourceID="RadClientDataSource1">
    <CenterSettings Latitude="30.2681" Longitude="-97.7448" />
    <ClientEvents OnShapeCreated="onShapeCreated" OnShapeFeatureCreated="onShapeFeatureCreated"
        OnShapeMouseEnter="onShapeMouseEnter" OnShapeMouseLeave="onShapeMouseLeave" />
    <LayersCollection>
        <telerik:MapLayer Type="Shape" ClientDataSourceID="RadClientDataSource1">
            <StyleSettings>
                <FillSettings Opacity="0.7" />
            </StyleSettings>
        </telerik:MapLayer>
    </LayersCollection>
</telerik:RadMap>

<telerik:RadClientDataSource ID="RadClientDataSource1" runat="server">
    <DataSource>
        <WebServiceDataSourceSettings ServiceType="GeoJSON">
            <Select Url="states.json" DataType="JSON" />
        </WebServiceDataSourceSettings>
    </DataSource>
</telerik:RadClientDataSource>
For creating the shapes and displaying their associated data, we'll use the OnShapeCreated and OnShapeFeatureCreated events of the Kendo jQuery map (remember that the RadMap is actually a wrapper of its jQuery counterpart, and we can utilize its API).
Coloring the states based on their values is achievied inside the OnShapeCreated event handler:
var scale = chroma
    .scale(["white", "green"])
    .domain([1, 300]); // For the chroma you'll need the chroma.min.js scriopt referenced in the <head> tag of your project

function onShapeCreated(e) {
    var shape = e.shape;
    var customValue = shape.dataItem.properties.density; // Assuming 'density' is part of your data
    if (customValue > 100) {
        shape.options.fill.set("color", "red"); // Red for values greater than 100
    } else {
        shape.options.fill.set("color", "blue"); // Blue otherwise
    }
}

function onShapeFeatureCreated(e) {
    e.group.options.tooltip = {
        content: e.properties.name + "<br/>Density: " + e.properties.density,
        position: "cursor",
        offset: 10,
        width: 120
    };
}

function onShapeMouseEnter(e) {
    e.shape.options.set("fill.opacity", 1);
}

function onShapeMouseLeave(e) {
    e.shape.options.set("fill.opacity", 0.7);
}
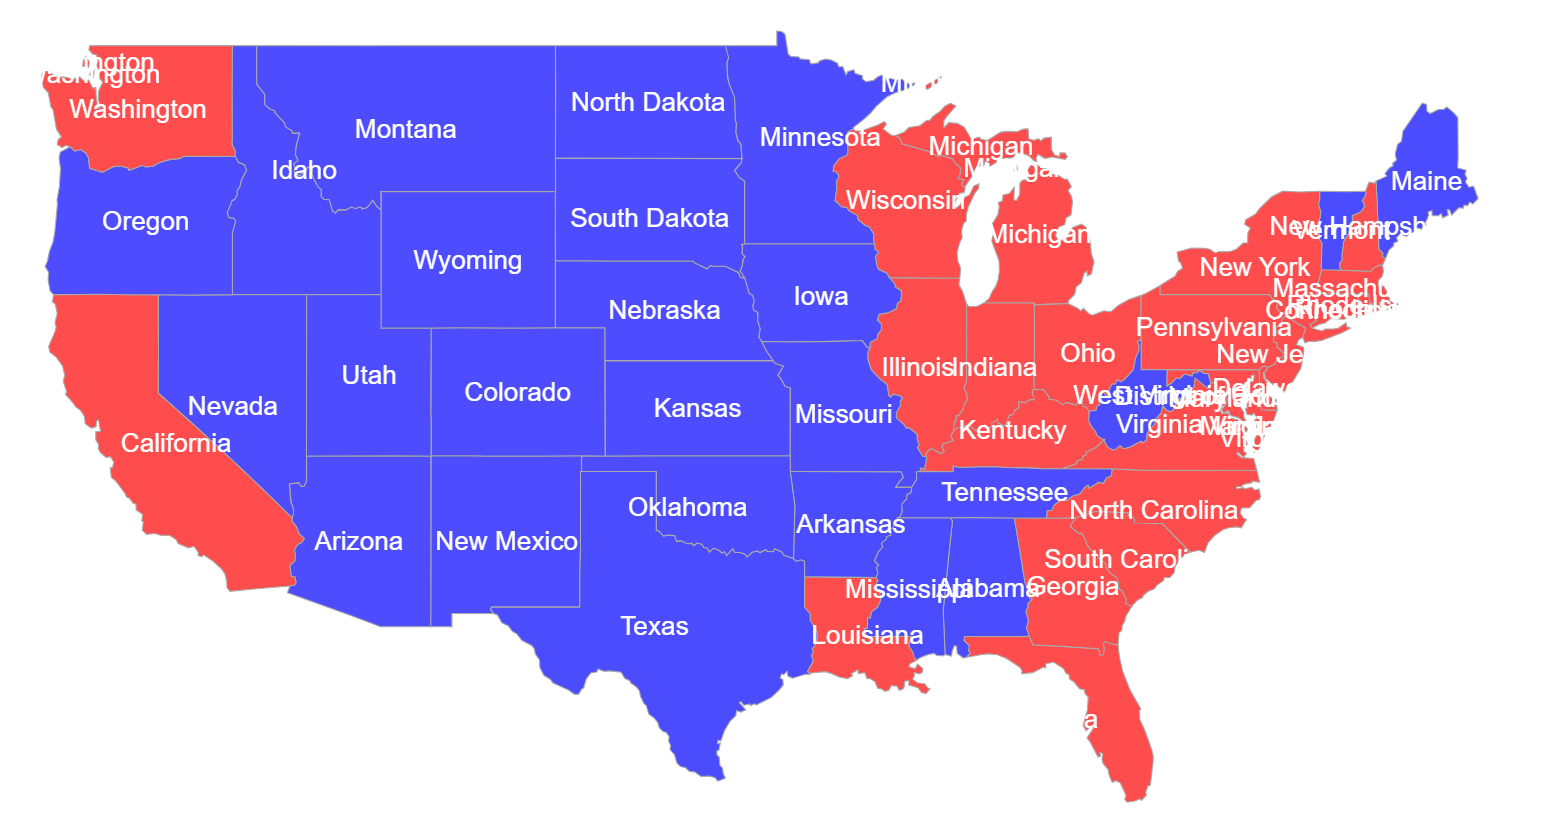
If you wish to display the text on the state itself, you can do that by creating a label with the name of the state. To do that, you can utilize a si milar approach as the one shown in the Add Titles to Map ShapesAdd Titles to Map Shapes article.
function onShapeCreated(e) {
    var bbox = e.shape.bbox(); // Get the "box" of each of the states
    var center = bbox.center(); // We need the center, in order to later display the label exactly on it.

    var labelText = e.shape.dataItem.properties.name; // The JSON file with the states has their corresponding name, so the label text will be the name of each state
    var label = new kendo.drawing.Text(labelText);
    label.options.fill.color = "#FFFFFF"; // Set the color to white
    var labelCenter = label.bbox().center();

    label.position([ // Position the label
        center.x - labelCenter.x,
        center.y - labelCenter.y
    ]);

    e.layer.surface.draw(label); // Render the label on the layer surface

    // Ommited for clearance
}
Result
