Set Gradient Color to PlotArea
This help article shows how to set a gradient color to the PlotArea of the RadHtmlChart.
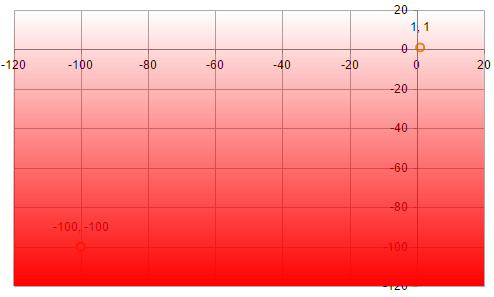
Generally, the PlotArea of the RadHtmlChart doesn't provide gradient colors. You can, however, use the Kendo Drawing API in order to draw gradient colors over the PlotArea once the chart is rendered. You can see the code that creates Figure 1 in Example 1.
Figure 1: A chart that has a gradient color to its PlotArea.
Example 1: Draw a gradient over the chart's PlotArea via the Kendo UI Drawing API.
function chartLoad(chart) {
    var chart = chart.get_kendoWidget();
    var draw = kendo.drawing;
    var geom = kendo.geometry;

    var gradient = new draw.LinearGradient({
        start: [0, 0], // Bottom left
        end: [0, 1],   // Top left
        stops: [{
            offset: 0,
            color: "#f00",
            opacity: 0
        }, {
            offset: 1,
            color: "#f00",
            opacity: 1
        }]
    });

    var xAxis = chart.getAxis("xAxis");
    var yAxis = chart.getAxis("yAxis");
    var xSlot = xAxis.slot(xAxis.range().min, xAxis.range().max);
    var ySlot = yAxis.slot(yAxis.range().min, yAxis.range().max);

    var rect = new geom.Rect([
        // Origin X, Y
        xSlot.origin.x, ySlot.origin.y
    ], [
        // Width, height
        xSlot.width(), ySlot.height()
    ]);

    var path = draw.Path.fromRect(rect, {
        stroke: null,
        fill: gradient
    });
    setTimeout(function () {
        chart.surface.draw(path);
    }, 10);
}
<telerik:RadHtmlChart ID="RadHtmlChart1" runat="server" Width="500px" Height="300px">
    <ClientEvents OnLoad="chartLoad" />
    <PlotArea>
        <YAxis Name="yAxis">
            <MinorGridLines Visible="false" />
        </YAxis>
        <XAxis Name="xAxis">
            <MinorGridLines Visible="false" />
        </XAxis>
        <Series>
            <telerik:ScatterSeries>
                <SeriesItems>
                    <telerik:ScatterSeriesItem X="1" Y="1" />
                    <telerik:ScatterSeriesItem X="-100" Y="-100" />
                </SeriesItems>
            </telerik:ScatterSeries>
        </Series>
    </PlotArea>
</telerik:RadHtmlChart>