Pan and Zoom
Pan and Zoom help end-user to navigate through and zoom in/out the ASP NET AJAX Chart. You can find here more details how to configure and adjust these features.
Pan and Zoom are supported in RadHtmlChart as of Q1 2016. They are also available only for series that use cartesian coordinate system (i.e., category and numeric series).
Here is a list with the sections in this article:
Pan
Figure 1: Chart that can be panned to all directions (the result from the configuration in Example 1).

Example 1: Enabling Pan in HtmlChart.
<telerik:RadHtmlChart runat="server" ID="RadHtmlChart1" Width="600px" Height="400px">
    <Pan Enabled="true" />
    <PlotArea>
        <Series>
            <telerik:ColumnSeries>
                <SeriesItems>
                    <telerik:CategorySeriesItem Y="10" />
                    <telerik:CategorySeriesItem Y="15" />
                    <telerik:CategorySeriesItem Y="53" />
                    <telerik:CategorySeriesItem Y="0" />
                    <telerik:CategorySeriesItem Y="120" />
                    <telerik:CategorySeriesItem Y="15" />
                    <telerik:CategorySeriesItem Y="6" />
                    <telerik:CategorySeriesItem Y="29" />
                    <telerik:CategorySeriesItem Y="31" />
                    <telerik:CategorySeriesItem Y="22" />
                    <telerik:CategorySeriesItem Y="86" />
                    <telerik:CategorySeriesItem Y="24" />
                    <telerik:CategorySeriesItem Y="53" />
                    <telerik:CategorySeriesItem Y="39" />
                    <telerik:CategorySeriesItem Y="29" />
                    <telerik:CategorySeriesItem Y="150" />
                    <telerik:CategorySeriesItem Y="45" />
                </SeriesItems>
            </telerik:ColumnSeries>
        </Series>
        <XAxis MinValue="2" MaxValue="15">
            <MinorGridLines Visible="false"/>
        </XAxis>
        <YAxis MinValue="0" MaxValue="140"/>
    </PlotArea>
</telerik:RadHtmlChart>
Configuration Properties for Pan
If modifier key for panning is specified, the user should hold the assigned key and pan in order to perform panning.
- Enabled—specifies if the chart can be panned;
- ModifierKey—specifies the key that should be pressed to activate panning. The available values are:
- None—no key is required;
- Ctrl—the Ctrl key should be pressed;
- Shift—the Shift key should be pressed;
- Alt—the Alt key should be pressed.
- Lock—specifies an axis that should not be panned. The supported values are:
- None—none of the series are locked (i.e., user can pan by either X and Y axis as in Figure 1.);
- X—X axis is locked, i.e., user can pan only by Y axis.
- Y—Y axis is locked. i.e., user can pan only by X axis.
Zoom
This tag exposes only the Enabled property that toggles the entire Zoom feature. If set to false both MouseWheel and Selection features will be disabled.
Figure 2: Chart that is zoomed using Selection, where selection is locked for Y axis (the result from the configuration in Example 2).
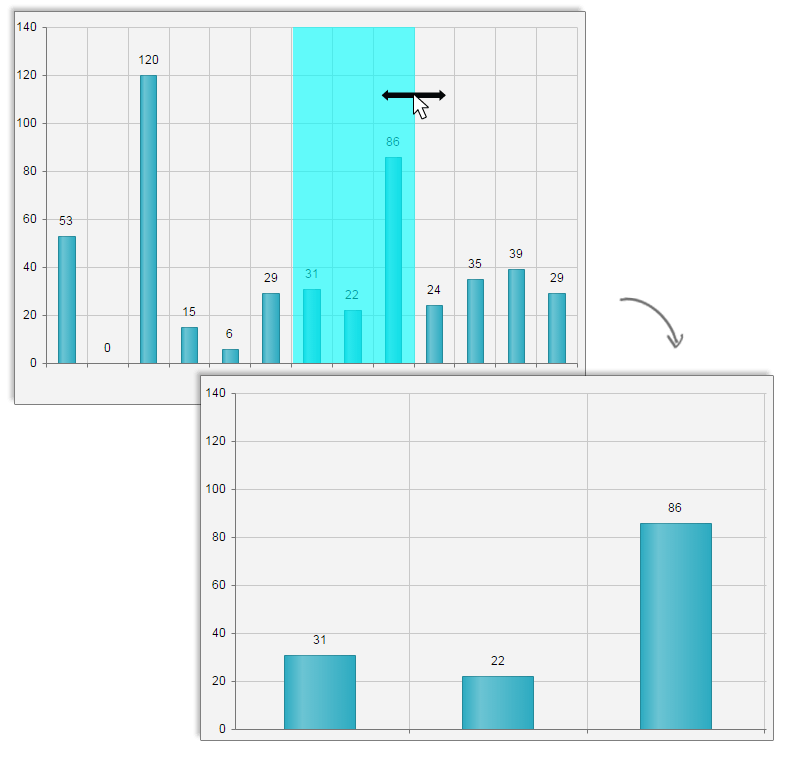
Example 2: Enabling MouseWheel-Zoom and with Selection-Zoom locked for Y axis.
<telerik:RadHtmlChart runat="server" ID="RadHtmlChart1" Width="600px" Height="400px">
    <Pan Enabled="true" />
    <Zoom Enabled="true">
        <MouseWheel Enabled="true" Lock="Y" />
        <Selection Enabled="true" Lock="Y" ModifierKey="Shift" />
    </Zoom>
    <PlotArea>
        <Series>
            <telerik:ColumnSeries>
                <SeriesItems>
                    <telerik:CategorySeriesItem Y="10" />
                    <telerik:CategorySeriesItem Y="15" />
                    <telerik:CategorySeriesItem Y="53" />
                    <telerik:CategorySeriesItem Y="0" />
                    <telerik:CategorySeriesItem Y="120" />
                    <telerik:CategorySeriesItem Y="15" />
                    <telerik:CategorySeriesItem Y="6" />
                    <telerik:CategorySeriesItem Y="29" />
                    <telerik:CategorySeriesItem Y="31" />
                    <telerik:CategorySeriesItem Y="22" />
                    <telerik:CategorySeriesItem Y="86" />
                    <telerik:CategorySeriesItem Y="24" />
                    <telerik:CategorySeriesItem Y="53" />
                    <telerik:CategorySeriesItem Y="39" />
                    <telerik:CategorySeriesItem Y="29" />
                    <telerik:CategorySeriesItem Y="150" />
                    <telerik:CategorySeriesItem Y="45" />
                </SeriesItems>
            </telerik:ColumnSeries>
        </Series>
        <XAxis MinValue="2" MaxValue="15">
            <MinorGridLines Visible="false" />
        </XAxis>
        <YAxis MinValue="0" MaxValue="140"></YAxis>
    </PlotArea>
</telerik:RadHtmlChart>
Configuration Properties for Zoom
MouseWheel
- Enabled—specifies if the chart can be zoomed via the mousewheel;
- Lock—specifies an axis that should not be zoomed via the mousewheel. The supported values are:
- None—none of the series are locked (i.e., user can zoom by either X and Y axis.);
- X—X axis is locked, i.e., user can zoom only by Y axis.
- Y—Y axis is locked. i.e., user can zoom only by X axis.
Selection
If Selection is enabled without a modifier key (or if ModifierKey property is set to None), user will be able to just click and draw an area in the chart and zoom it. Correspondingly, if a modifier key is configured, user should hold the assigned key in order to draw the area to be zoomed. As shown in Figure 2, the are to be zoomed is created by holding the Shift key.
- Enabled—specifies if the chart can be zoomed via selection method;
- ModifierKey—specifies the key that should be pressed to activate selection. The available values are:
- None—no key is required;
- Ctrl—the Ctrl key should be pressed;
- Shift—the Shift key should be pressed;
- Alt—the Alt key should be pressed.
- Lock—specifies an axis that should not be zoomed via the selection method. The supported values are:
- None—none of the series are locked (i.e., user can zoom by either X and Y axis.);
- X—X axis is locked, i.e., user can zoom only by Y axis.
- Y—Y axis is locked. i.e., user can zoom only by X axis (Figure 2).
Controlling Initial View
In order to render the chart with some initial zoom level, you can use the min (MinValue property) and max (MaxValue property) values of the axis to be zoomed.
In examples 1 and 2 you can see how defining initially the min and max values actually zoom accordingly into X and Y axis. Thus, enabling the end user to either zoom or pan the chart.