Crosshairs
The Crosshair functionality of the ASP NET AJAX Chart can be used as of Q3 2020.
The RadHtmlChart crosshairs are lines, which are perpendicular to the axes and enable the user to see the exact value at the current cursor position.
You can customize the look of the crosshair through the chosen axis CrosshairAppearance tag, and style its tooltips through its nested TooltipsAppearance.
The crosshair is displayed when the XAxis/YAxis
CrosshairAppearance.Visibleis set to true.
The crosshair functionality is not supported in Donut, Pie, Funnel, Polar and Radar charts.
Example 1: Shows the markup code used to create Figure 1, which demonstrates configured crosshairs in the chart.
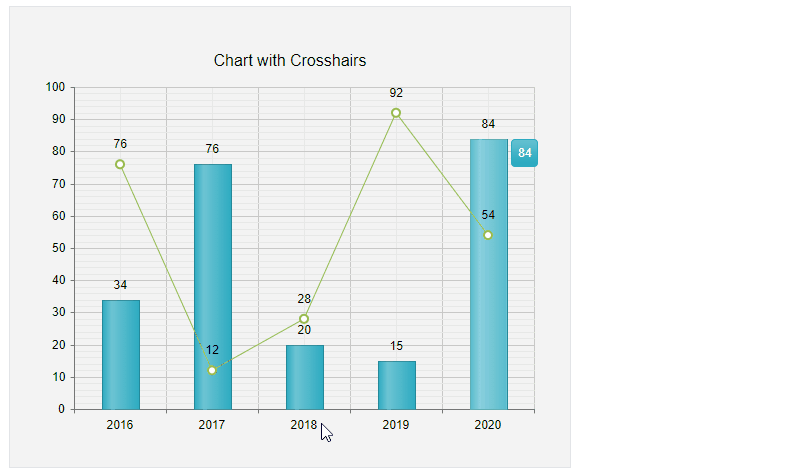
You can create Figure 1 using the markup in Example 1.
Example 1: Shows an implementation of chart with enabled xAxis and yAxis crosshairs.
        <telerik:RadHtmlChart runat="server" ID="ChartWithColumnsAndLineSeries" Width="500px" Height="400px">
            <ChartTitle Text="Chart with Crosshairs">
            </ChartTitle>
            <PlotArea>
                <Series>
                    <telerik:ColumnSeries>
                        <SeriesItems>
                            <telerik:CategorySeriesItem Y="34" />
                            <telerik:CategorySeriesItem Y="76" />
                            <telerik:CategorySeriesItem Y="20" />
                            <telerik:CategorySeriesItem Y="15" />
                            <telerik:CategorySeriesItem Y="84" />
                        </SeriesItems>
                        <TooltipsAppearance Color="White" />
                    </telerik:ColumnSeries>
                    <telerik:LineSeries>
                        <SeriesItems>
                            <telerik:CategorySeriesItem Y="76" />
                            <telerik:CategorySeriesItem Y="12" />
                            <telerik:CategorySeriesItem Y="28" />
                            <telerik:CategorySeriesItem Y="92" />
                            <telerik:CategorySeriesItem Y="54" />
                        </SeriesItems>
                        <TooltipsAppearance Color="White" />
                    </telerik:LineSeries>
                </Series>
                <XAxis>
                    <CrosshairAppearance Color="#0000ff" DashType="Solid" Opacity="0.5" Visible="true" Width="2">
                        <TooltipsAppearance BackgroundColor="#0066ff" Color="#ffffff" Visible="true" DataFormatString="XAxis value is {0}">
                            <BorderAppearance Width="1" Color="#0000ff" />
                        </TooltipsAppearance>
                    </CrosshairAppearance>
                    <Items>
                        <telerik:AxisItem LabelText="2016" />
                        <telerik:AxisItem LabelText="2017" />
                        <telerik:AxisItem LabelText="2018" />
                        <telerik:AxisItem LabelText="2019" />
                        <telerik:AxisItem LabelText="2020" />
                    </Items>
                </XAxis>
                <YAxis>
                    <CrosshairAppearance Color="Red" DashType="Dot" Opacity="1" Visible="true" Width="3">
                        <TooltipsAppearance BackgroundColor="#ff6666" Color="#ffffff" Visible="true" DataFormatString="YAxis value is {0}">
                            <BorderAppearance Width="1" Color="#ff0000" />
                        </TooltipsAppearance>
                    </CrosshairAppearance>
                </YAxis>
            </PlotArea>
            <Legend>
                <Appearance Visible="false" />
            </Legend>
        </telerik:RadHtmlChart>