Using Client Templates in Legend and Axes Labels
This article discusses the client templates for Legend items and Axes labels exposed in the ASP NET AJAX Chart.
The features listed here are available as of R2 2016.
You can quickly navigate through the sections in this article:
Client Templates for Legend Items
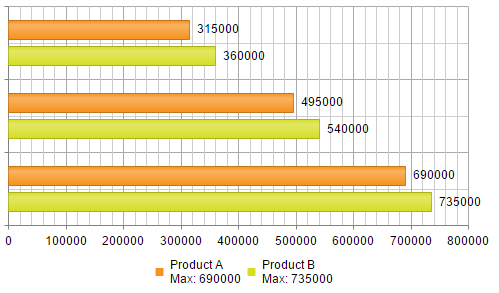
The client template for the Legend items can be controlled by using the ClientTemplate property, exposed in the LabelsAppearance property (Example 1).
The values that can be resolved and used in the client templates are:
-
text- the text the legend item. -
series- the data series. -
value- the point value. (only for donut and pie charts) -
percentage- the point value represented as a percentage value. Available only for donut, pie and 100% stacked charts.
More details are avilable in Kendo documentation—legend.labels.template.
Figure 1: Result from the code in Example 1.

Example 1: Using client templates for the Legend items.
<telerik:RadHtmlChart runat="server" ID="BarChart1" Width="500px" Height="300px">
    <PlotArea>
        <Series>
            <telerik:BarSeries Name="Product A">
                <SeriesItems>
                    <telerik:CategorySeriesItem Y="315000" />
                    <telerik:CategorySeriesItem Y="495000" />
                    <telerik:CategorySeriesItem Y="690000" />
                </SeriesItems>
            </telerik:BarSeries>
            <telerik:BarSeries Name="Product B">
                <SeriesItems>
                    <telerik:CategorySeriesItem Y="360000" />
                    <telerik:CategorySeriesItem Y="540000" />
                    <telerik:CategorySeriesItem Y="735000" />
                </SeriesItems>
            </telerik:BarSeries>
        </Series>
    </PlotArea>
    <Legend>
        <Appearance Position="Bottom" >
            <ClientTemplate>
                #= text #
                # var values = []#
                # for (var i = 0; i < series.data.length; i++) {
                   values.push(series.data[i].value);
                 } #
                \n
                Max: #= Math.max(...values) #
            </ClientTemplate>
        </Appearance>
    </Legend>
</telerik:RadHtmlChart>
Client Templates for Axes Labels
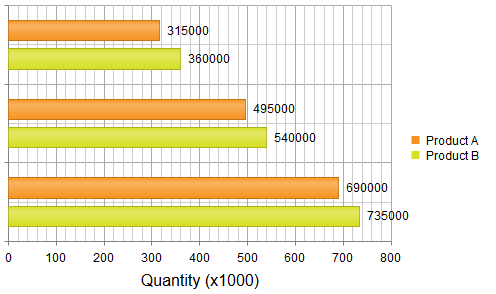
The client template for the axes' labels can be controlled by using the ClientTemplate property, exposed in the LabelsAppearance property (Example 2).
The value that can be resolved and used in the client templates is:
-
value- the text of the axis' label.
More details are available in the Kendo documentation—valueAxis.labels.template.
Figure 2: Result from the code in Example 2.

Example 2: Using client templates for the Legend items.
<telerik:RadHtmlChart runat="server" ID="BarChart1" Width="500px" Height="300px">
    <PlotArea>
        <Series>
            <telerik:BarSeries Name="Product A">
                <SeriesItems>
                    <telerik:CategorySeriesItem Y="315000" />
                    <telerik:CategorySeriesItem Y="495000" />
                    <telerik:CategorySeriesItem Y="690000" />
                </SeriesItems>
            </telerik:BarSeries>
            <telerik:BarSeries Name="Product B">
                <SeriesItems>
                    <telerik:CategorySeriesItem Y="360000" />
                    <telerik:CategorySeriesItem Y="540000" />
                    <telerik:CategorySeriesItem Y="735000" />
                </SeriesItems>
            </telerik:BarSeries>
        </Series>
        <YAxis>
            <TitleAppearance Text="Quantity (x1000)" />
            <LabelsAppearance>
                <ClientTemplate>
                    #= value / 1000 #
                </ClientTemplate>
            </LabelsAppearance>
        </YAxis>
    </PlotArea>
</telerik:RadHtmlChart>