Shared Template for ToolTips
Shared Templates for ToolTips
You can hover over a single series item and display a common tooltip with information about all the series items from the particular category. As of Q3 2013, the templates for tooltips in the ASP NET AJAX Chart can be shared among all the series items within their group. You can share these templatesby setting the following properties in the CommonTooltipsAppearance element, exposed by the PlotArea of the chart:
Shared - You must explicitly set this property to true for standard charts. For Sparkline layout, the default value is true.
SharedTemplate - You must set the composite SharedTemplate property to the appropriate string that represents the desired shared template that you want to apply to the tooltips when they render. The SharedTemplate composite property can use the following fields:
points - The category points (
#= points[i].series.name#, #= points[i].value #) where i is the index of the series.category - The category name (
#= category #) The string delimited inside#=.....#is the expression to be evaluated. The tooltips are HTML, so HTML can be used outside of the expression tags.
You can use number formats inside SharedTemplates . You can find more information in this Formatting Numbers article in the section called Formatting Labels and Tooltips by Using their Client Templates.
Example of Using SharedTemplates for ToolTips
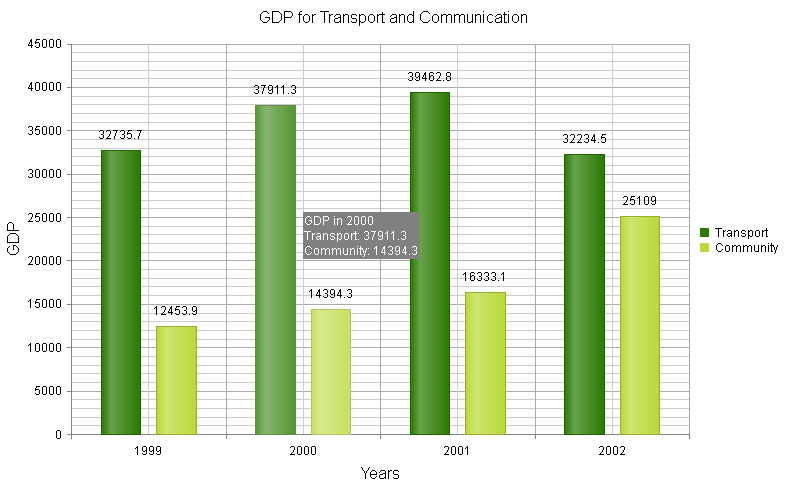
This example illustrates the code that configures SharedTemplate for tooltips in Example 1 and shows the actual output in Figure 1.
Figure 1: Hover over a single series item and display common information about all the series items from the category in the tooltip.

The chart in Figure 1 was created with the markup in Example 1.
Example 1: You can share the information about the series items from the category in a tooltip by configuring the Shared and SharedTemplate properties exposed by the CommonTooltipsAppearance element in the PlotArea.
<telerik:radhtmlchart runat="server" id="ColumnChart" width="800" height="500">
    <ChartTitle Text="GDP for Transport and Communication">
    </ChartTitle>
    <PlotArea>
        <CommonTooltipsAppearance Shared="true" Color="White" BackgroundColor="Gray">
            <SharedTemplate>
                <div>GDP in #= category #</div>
                 # for (var i = 0; i < points.length; i++) { #
                <div>#: points[i].series.name#: #: points[i].value #</div>
                # } #
            </SharedTemplate>
        </CommonTooltipsAppearance>
        <XAxis>
            <Items>
                <telerik:AxisItem LabelText="1999"></telerik:AxisItem>
                <telerik:AxisItem LabelText="2000"></telerik:AxisItem>
                <telerik:AxisItem LabelText="2001"></telerik:AxisItem>
                <telerik:AxisItem LabelText="2002"></telerik:AxisItem>
            </Items>
            <TitleAppearance Text="Years">
            </TitleAppearance>
        </XAxis>
        <YAxis>
            <TitleAppearance Text="GDP">
            </TitleAppearance>
        </YAxis>
        <Series>
            <telerik:ColumnSeries Name="Transport">
                <Appearance>
                    <FillStyle BackgroundColor="#2A7A00"></FillStyle>
                </Appearance>
                <SeriesItems>
                    <telerik:CategorySeriesItem Y="32735.7"></telerik:CategorySeriesItem>
                    <telerik:CategorySeriesItem Y="37911.3"></telerik:CategorySeriesItem>
                    <telerik:CategorySeriesItem Y="39462.8"></telerik:CategorySeriesItem>
                    <telerik:CategorySeriesItem Y="32234.5"></telerik:CategorySeriesItem>
                </SeriesItems>
            </telerik:ColumnSeries>
            <telerik:ColumnSeries Name="Community">
                <Appearance>
                    <FillStyle BackgroundColor="#B8D936"></FillStyle>
                </Appearance>
                <SeriesItems>
                    <telerik:CategorySeriesItem Y="12453.9"></telerik:CategorySeriesItem>
                    <telerik:CategorySeriesItem Y="14394.3"></telerik:CategorySeriesItem>
                    <telerik:CategorySeriesItem Y="16333.1"></telerik:CategorySeriesItem>
                    <telerik:CategorySeriesItem Y="25109"></telerik:CategorySeriesItem>
                </SeriesItems>
            </telerik:ColumnSeries>
        </Series>
    </PlotArea>
</telerik:radhtmlchart>
To get a total of all the series, just define a function that takes the
pointsas an argument and have it generate the needed string instead of defining everything in the tamplate. For example, put#=getTotal(points)#in the<SharedTemplate>and here is a sample implementation of the function:function getTotal(points) { var total = 0; for (var i = 0; i < points.length; i++) { total += points[i].value; } return total; }