Date Axis Base Unit Steps
This help article illustrates how to configure the step of categories for a date axis in the ASP NET AJAX Chart.
You can control the step through which the categories will be plotted for all or particular base units through the BaseUnitStep/EnableBaseUnitStepAuto properties and the AutoBaseUnitSteps tag.
Configure a Common Step
You can configure a common step for all the base units through the following properties:
-
BaseUnitStep - The property takes an integer value greater than 0.
Figure 1: Date axis with BaseUnitStep set to 3 created with Example 1.
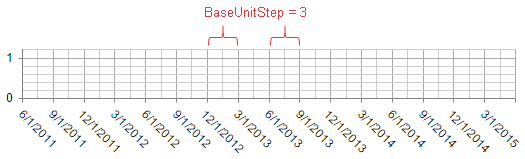
Example 1: Date axis with BaseUnitStep set to 3 shown in Figure 1.
ASP.NET
<telerik:RadHtmlChart ID="RadHtmlChart1" runat="server" Width="600" Height="400">
    <PlotArea>
        <XAxis BaseUnitStep="3" DataLabelsField="SellDate">
            <LabelsAppearance RotationAngle="45" DataFormatString="d"></LabelsAppearance>
        </XAxis>
        <Series>
            <telerik:LineSeries Name="Series 1" DataFieldY="SellQuantity">
            </telerik:LineSeries>
        </Series>
    </PlotArea>
</telerik:RadHtmlChart>
Chart data source can be obtained from Example 2 below.
-
EnableBaseUnitStepAuto - A boolean property that indicates whether the step will be automatically calculated based on the maximum available x-axis categories, defined through the MaxDateGroups property.
Figure 2: Date axis with MaxDateGroups="5" and EnableBaseUnitStepAuto="true", created with Example 2.
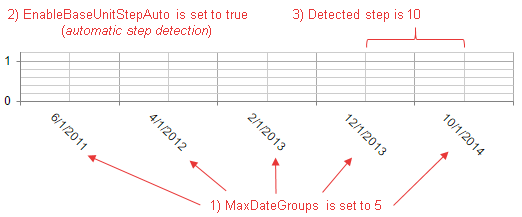
Example 2: Date axis with MaxDateGroups="5" and EnableBaseUnitStepAuto="true" shown in Figure 2.
<telerik:RadHtmlChart ID="RadHtmlChart1" runat="server" Width="600" Height="400">
    <PlotArea>
        <XAxis MaxDateGroups="5" EnableBaseUnitStepAuto="true" DataLabelsField="SellDate">
            <LabelsAppearance RotationAngle="45" DataFormatString="d"></LabelsAppearance>
        </XAxis>
        <Series>
            <telerik:LineSeries Name="Series 1" DataFieldY="SellQuantity">
            </telerik:LineSeries>
        </Series>
    </PlotArea>
</telerik:RadHtmlChart>
protected void Page_Init(object sender, EventArgs e)
{

    RadHtmlChart1.DataSource = GetData();
    RadHtmlChart1.DataBind();
}

protected DataTable GetData()
{
    DataTable dt = new DataTable();

    dt.Columns.Add("ID", typeof(int));
    dt.Columns.Add("SellQuantity", typeof(int));
    dt.Columns.Add("SellDate", typeof(DateTime));

    dt.Rows.Add(1, 2, new DateTime(2011, 06, 12));
    dt.Rows.Add(2, 5, new DateTime(2011, 12, 12));
    dt.Rows.Add(3, 6, new DateTime(2012, 06, 17));
    dt.Rows.Add(4, 4, new DateTime(2012, 09, 18));
    dt.Rows.Add(5, 7, new DateTime(2015, 03, 18));

    return dt;
}
Protected Sub Page_Init(sender As Object, e As EventArgs) Handles Me.Init

    RadHtmlChart1.DataSource = GetData()
    RadHtmlChart1.DataBind()

End Sub

Protected Function GetData() As DataTable

    Dim dt As New DataTable()

    dt.Columns.Add("ID", GetType(Integer))
    dt.Columns.Add("SellQuantity", GetType(Integer))
    dt.Columns.Add("SellDate", GetType(DateTime))

    dt.Rows.Add(1, 2, New DateTime(2011, 6, 12))
    dt.Rows.Add(2, 5, New DateTime(2011, 12, 12))
    dt.Rows.Add(3, 6, New DateTime(2012, 6, 17))
    dt.Rows.Add(4, 4, New DateTime(2012, 9, 18))
    dt.Rows.Add(5, 7, New DateTime(2015, 3, 18))

    Return dt

End Function
EnableBaseUnitStepAuto="true" will be ignored if the BaseUnit property is set to "Fit".
Configure a Step for a Dynamic BaseUnit
You can set certain steps for particular base units through the AutoBaseUnitSteps collections. The functionality requires that you have enabled the dynamic BaseUnit detection by setting the BaseUnit property to Fit.
You can see how the BaseUnit property and the corresponding BaseUnitStep value change when you modify the MaxDateGroups in Figure 3.1, Figure 3.2, Figure 3.3 and Example 3.
Figure 3.1: A step of 60 is used for the detected "Days" BaseUnit when MaxDateGroups is 23. The code is shown in Example 3.
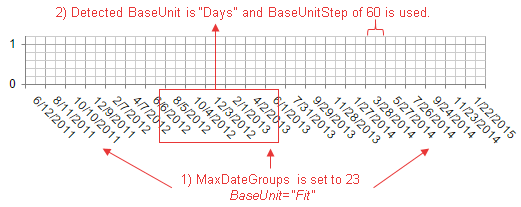
Example 3: Setting arrays of steps for different units (e.g., "Months" and "Days"). The output is shown in Figure 3.1.
ASP.NET
<telerik:RadHtmlChart ID="RadHtmlChart1" runat="server" Width="600" Height="400">
    <PlotArea>
        <XAxis BaseUnit="Fit" MaxDateGroups="23" DataLabelsField="SellDate">
            <AutoBaseUnitSteps>
                <Months>
                    <telerik:BaseUnitStep Value="3" />
                    <telerik:BaseUnitStep Value="6" />
                </Months>
                <Days>
                    <telerik:BaseUnitStep Value="1" />
                    <telerik:BaseUnitStep Value="60" />
                </Days>
            </AutoBaseUnitSteps>
            <LabelsAppearance RotationAngle="45" DataFormatString="d"></LabelsAppearance>
        </XAxis>
        <Series>
            <telerik:LineSeries Name="Series 1" DataFieldY="SellQuantity">
            </telerik:LineSeries>
        </Series>
    </PlotArea>
</telerik:RadHtmlChart>
Chart data source can be obtained from Example 2 above.
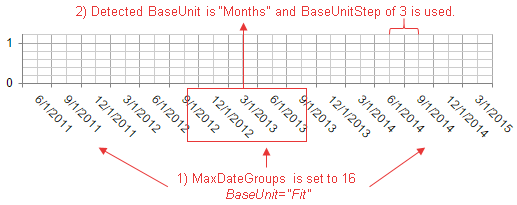
If, however, you decrease the max date x-axis groups to 16, the step of 6 from the months base unit will be considered (Figure 3.2).
Figure 3.2: Decreasing the MaxDateGroups will force the chart to switch its BaseUnit and BaseUnitStep.
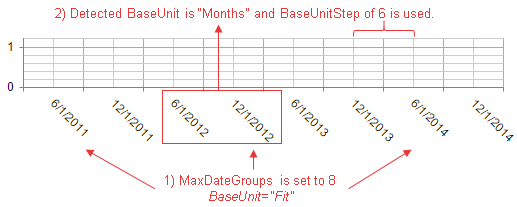
A further decrease of the MaxDateGroups property to 8 will trigger the chart to select a higher value of 6 for the BaseUnitStep property (Figure 3.3). The current "Months" BaseUnit will be preserved.
Figure 3.3: Setting MaxDateGroups to 8 forces the chart to select a higher BaseUnitStep of 6 and keeps the current "Months" BaseUnit.
If there isn't an exact BaseUnitStep value defined that satisfies MaxDateGroups, the chart will round it to the closest value.