Create Custom Skin
This help article illustrates how to create a custom skin for the ASP NET AJAX Chart.
Modify an Existing Skin
RadHtmlChart renders entirely on the client-side as SVG/Canvas. The control gets the skin-specific colors from a JS file (RadHtmlChartSkins.js), so that you cannot use pure CSS to style its elements.
To modify an existing chart skin you can follow the steps below:
Go to your telerik.com account and download the source code of the UI for ASP.NET AJAX controls. The file is called
Telerik_UI_for_ASP.NET_AJAX_<version>_Source.zipGo to the
Telerik.Web.UI\HtmlChartfolder of the Telerik® UI for ASP.NET AJAX Source Code.-
Copy the
RadHtmlChartSkins.jsfile to your project and open it.You can also find a stripped down version of this file in the JavaScript section of Example 2.
-
Find the skin you want to modify and customize the colors of the corresponding elements. Example 1 shows how to set a silver background for the chart area and colorize the first two series with green and blue.
Example 1: Customize the Black skin of RadHtmlChart via the
RadHtmlChartSkins.jsfile.JavaScript
Black: {
    chart: deepExtend({}, chartBaseTheme, {
        chartArea: {
            background: "silver"
        },
        seriesColors: ["green", "blue"],
    })
},
Set the name of the customized skin to the RadHtmlChart and reference the
RadHtmlChartSkins.jsfile from the same page where the chart resides.
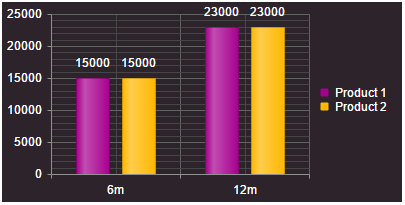
You can see the output of the modified Black skin in Figure 1.
Example 2: Reference the RadHtmlChartSkins.js file from the page where the RadHtmlChart resides and set the skin.
<telerik:RadScriptManager ID="RadScriptManager1" runat="server"></telerik:RadScriptManager>
<script src="RadHtmlChartSkins.js"></script>
<telerik:RadHtmlChart runat="server" ID="RadHtmlChart1" Width="400px" Height="200px" Skin="Black">
    <PlotArea>
        <Series>
            <telerik:ColumnSeries Name="Product 1">
                <SeriesItems>
                    <telerik:CategorySeriesItem Y="15000" />
                    <telerik:CategorySeriesItem Y="23000" />
                </SeriesItems>
            </telerik:ColumnSeries>
            <telerik:ColumnSeries Name="Product 2">
                <SeriesItems>
                    <telerik:CategorySeriesItem Y="15000" />
                    <telerik:CategorySeriesItem Y="23000" />
                </SeriesItems>
            </telerik:ColumnSeries>
        </Series>
        <XAxis>
            <Items>
                <telerik:AxisItem LabelText="6m" />
                <telerik:AxisItem LabelText="12m" />
            </Items>
        </XAxis>
    </PlotArea>
</telerik:RadHtmlChart>
//RadHtmlChartSkins.js
; (function ($) {

...

    var chartThemes = {

        Black: {
            chart: deepExtend({}, chartBaseTheme, {
                title: {
                    color: WHITE
                },
                legend: {
                    labels: {
                        color: WHITE
                    }
                },
                seriesDefaults: {
                    labels: {
                        color: WHITE
                    },
                    line: {
                        markers: {
                            background: "#3d3d3d"
                        }
                    },
                    verticalLine: {
                        markers: {
                            background: "#3d3d3d"
                        }
                    },
                    scatter: {
                        markers: {
                            background: "#3d3d3d"
                        }
                    },
                    scatterLine: {
                        markers: {
                            background: "#3d3d3d"
                        }
                    },
                    area: {
                        opacity: 0.4
                    },
                    candlestick: {
                        downColor: "#888888"
                    }
                },
                chartArea: {
                    background: "#3d3d3d"
                },
                seriesColors: ["#f9a319", "#1edee2", "#9eda29", "#ffce00", "#dd007f", "#01ae98", "#ffc961", "#ff6714", "#fa1852", "#008bcb"],
                categoryAxis: {
                    majorGridLines: {
                        visible: true
                    }
                },
                axisDefaults: {
                    line: {
                        color: "#919191"
                    },
                    labels: {
                        color: WHITE
                    },
                    majorGridLines: {
                        color: "#636363"
                    },
                    minorGridLines: {
                        color: "#464646"
                    },
                    title: {
                        color: WHITE
                    }
                },
                tooltip: {
                    color: WHITE
                }
            })

        }
...
    };

    // Exports ================================================================
    deepExtend(dataviz.ui, {
        themes: chartThemes
    });

})($telerik.$);
Figure 1: RadHtmlChart with a customized Black skin.
Create a New Skin
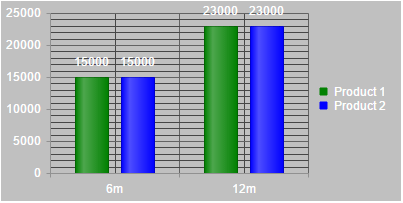
You can create a new skin out of an existing one by following the steps below. You can also find a fully runnable sample about creating a custom skin out of an existing one in Example 3 and see the output in Figure 2.
- Create a JSON that will store the chart element's colors. You can use the free Kendo UI Theme Builder for the purpose.
"chart": { "chartArea": { "background": "#2c232b" }, "seriesColors": [ "#a7008f", "#ffb800" ] } - Make a deep copy of an existing kendo dataviz theme and apply the created JSON to it.
var themes = kendo.dataviz.ui.themes; var MyTheme = kendo.deepExtend({}, themes.Black, { "chart": { "chartArea": { "background": "#2c232b" }, "seriesColors": ["#a7008f", "#ffb800"] } } - Add the new theme to the kendo dataviz themes and set the theme name to the chart via the setOptions() method.
themes.MyTheme = MyTheme;
$find("<%=RadHtmlChart1.ClientID%>").get_kendoWidget().setOptions({ theme: "MyTheme" });
Example 3: Create and set a custom skin for the RadHtmlChart.
function chartLoad(chart) {
    var themes = kendo.dataviz.ui.themes;
    var MyTheme = kendo.deepExtend(
        // Deep copy
        {},
        // Base theme
        themes.Black,
        {
        // Customize the theme JSON
        "chart": {
            "chartArea": {
                "background": "#2c232b"
            },
            "seriesColors": [
                "#a7008f",
                "#ffb800"
            ]
        }
        }
    );

    themes.MyTheme = MyTheme;
    var kendoChart = chart.get_kendoWidget();
    kendoChart.setOptions({ theme: "MyTheme" });
}
<telerik:RadHtmlChart runat="server" ID="RadHtmlChart1" Width="400px" Height="200px">
    <ClientEvents OnLoad="chartLoad" />
    <PlotArea>
        <Series>
            <telerik:ColumnSeries Name="Product 1">
                <SeriesItems>
                    <telerik:CategorySeriesItem Y="15000" />
                    <telerik:CategorySeriesItem Y="23000" />
                </SeriesItems>
            </telerik:ColumnSeries>
            <telerik:ColumnSeries Name="Product 2">
                <SeriesItems>
                    <telerik:CategorySeriesItem Y="15000" />
                    <telerik:CategorySeriesItem Y="23000" />
                </SeriesItems>
            </telerik:ColumnSeries>
        </Series>
        <XAxis>
            <Items>
                <telerik:AxisItem LabelText="6m" />
                <telerik:AxisItem LabelText="12m" />
            </Items>
        </XAxis>
    </PlotArea>
</telerik:RadHtmlChart>
Figure 2: RadHtmlChart with new custom skin.