PointSeries
This series is visualized on the screen as separate points representing each of the data points.
Declaratively defined series
You can use the following definition to display a simple PointSeries
Example 1: Declaring an PointSeries in XAML
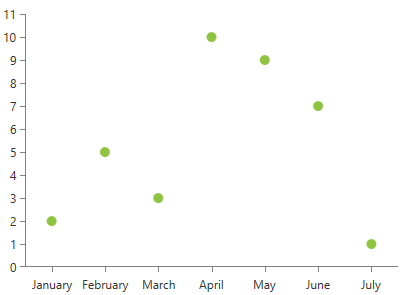
<telerik:RadCartesianChart Palette="Windows8">
<telerik:RadCartesianChart.HorizontalAxis>
    <telerik:CategoricalAxis/>
</telerik:RadCartesianChart.HorizontalAxis>
<telerik:RadCartesianChart.VerticalAxis>
    <telerik:LinearAxis />
</telerik:RadCartesianChart.VerticalAxis>
<telerik:RadCartesianChart.Series>
    <telerik:PointSeries>
        <telerik:PointSeries.DataPoints>
            <telerik:CategoricalDataPoint Category="January" Value="2" />
            <telerik:CategoricalDataPoint Category="February" Value="5" />
            <telerik:CategoricalDataPoint Category="March" Value="3" />
            <telerik:CategoricalDataPoint Category="April" Value="10" />
            <telerik:CategoricalDataPoint Category="May" Value="9" />
            <telerik:CategoricalDataPoint Category="June" Value="7" />
            <telerik:CategoricalDataPoint Category="July" Value="1" />
        </telerik:PointSeries.DataPoints>
    </telerik:PointSeries>
</telerik:RadCartesianChart.Series>
</telerik:RadCartesianChart>
Figure 1: PointSeries visual appearance
Properties
- CategoryBinding: A property of type DataPointBinding that gets or sets the property path that determines the category value of the data point.
- ValueBinding: A property of type DataPointBinding that gets or sets the property path that determines the value of the data point.
- PointSize: A property of type Size that get or sets the size of the points. This property will be ignored if PointTemplate property is set.
Data Binding
You can use the ValueBinding and CategoryBinding properties of the PointSeries to bind the DataPoints’ properties to the properties from your view models.
Example 2: Defining the view model
public class PlotInfo
{
    public string Category { get; set; }
    public double Value { get; set; }
}

//.......
this.DataContext = new ObservableCollection<PlotInfo>
{
    new PlotInfo() { Category = "January", Value = 2},
    //....
};
Example 3: Specify a PointSeries in XAML
<telerik:PointSeries ItemsSource="{Binding}" CategoryBinding="Category" ValueBinding="Value" />
See the Create Data-Bound Chart for more information on data binding in the RadChartView suite.
Styling the Series
You can see how to style the series using different properties in the PointSeries section of the Customizing CartesianChart Series help article.
Additionally, you can use the Palette property of the chart to change the colors of the PointSeries on a global scale. You can find more information about this feature in the Palettes section in our help documentation.