Chart Legend
ChartLegend is used to provide information about the charts shown on the chart area. The ChartLegend has Header, usually some text and items - one for each chart series.
To see how to style and template ChartLegend take a look at the Styling the Chart Legend topic.
This topic will make you familiar with the following things:
Automatic Legend Items Generation
In order to have legend items generated automatically, you have to use the property UseAutoGeneratedItems. When it is True (Default value), ChartLegend will add automatically one item for each chart series from the associated ChartArea.
<telerik:RadChart x:Name="radChart"
                  Width="511"
                  Height="362"
                  VerticalAlignment="Top">
    <telerik:RadChart.DefaultView>
        <telerik:ChartDefaultView>

            <telerik:ChartDefaultView.ChartLegend>
                <telerik:ChartLegend x:Name="chartLegend"
                                     Header="Top 10 Manufacturers"
                                     UseAutoGeneratedItems="True" />
            </telerik:ChartDefaultView.ChartLegend>
            <telerik:ChartDefaultView.ChartArea>
                <telerik:ChartArea LegendName="chartLegend" />

            </telerik:ChartDefaultView.ChartArea>

        </telerik:ChartDefaultView>
    </telerik:RadChart.DefaultView>
</telerik:RadChart>
By default, the RadChart.DefaultView.ChartLegend is associated with the RadChart.DefaultView.ChartArea. However, if you predefine the DefaultView (like it was done in the XAML above), be sure that the ChartArea has its property LegendName set to the name of the newly created ChartLegend. Otherwise, your legend items will not be auto generated.
If you want to set the legend title only, it is better to do it in the code-behind not in the XAML, because you will have to predefine the whole visual structure of the chart's default view.
this.radChart.DefaultView.ChartLegend.UseAutoGeneratedItems = true;
this.radChart.DefaultView.ChartLegend.Header = "Top 10 Manufacturers";
radChart.DefaultView.ChartLegend.UseAutoGeneratedItems = True
radChart.DefaultView.ChartLegend.Header = "Top 10 Manufacturers"
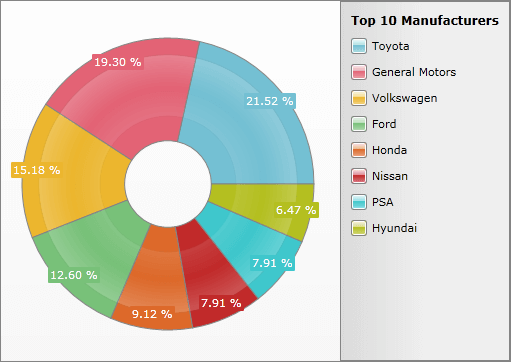
As you can see, the ChartLegend on the right side of the RadChart is automatically generated and has one item for each manufacturer (series).

Manual Legend Items Generation
If you need to explicitly create legend items, set the value of the property UseAutoGeneratedItems to False and manually add the items which you need to the chart legend.
Here is a small example which demonstrates how to create and add new legend items to the chart legend of a chart.
<telerik:RadChart>
    <telerik:RadChart.DefaultView>
        <telerik:ChartDefaultView>
            <!--  ...  -->
            <telerik:ChartDefaultView.ChartLegend>
                <telerik:ChartLegend Header="Top 10 Manufacturers" UseAutoGeneratedItems="False">
                    <telerik:ChartLegend.Items>
                        <telerik:ChartLegendItem Label="Item 1" MarkerFill="Blue" />
                        <telerik:ChartLegendItem Label="Item 2" MarkerFill="Green" />
                    </telerik:ChartLegend.Items>
                </telerik:ChartLegend>
            </telerik:ChartDefaultView.ChartLegend>
            <!--  ...  -->
        </telerik:ChartDefaultView>
    </telerik:RadChart.DefaultView>
</telerik:RadChart>
Telerik.Windows.Controls.RadChart radChart = new Telerik.Windows.Controls.RadChart();
radChart.DefaultView.ChartLegend.UseAutoGeneratedItems = false;

ChartLegendItem item1 = new ChartLegendItem();
item1.Label = "Item 1";
item1.MarkerFill = new SolidColorBrush(Colors.Blue);
radChart.DefaultView.ChartLegend.Items.Add( item1 );
ChartLegendItem item2 = new ChartLegendItem();
item2.Label = "Item 2";
item2.MarkerFill = new SolidColorBrush(Colors.Green);
radChart.DefaultView.ChartLegend.Items.Add( item2 );
Dim radChart As New Telerik.Windows.Controls.RadChart()
radChart.DefaultView.ChartLegend.UseAutoGeneratedItems = False
Dim item1 As New ChartLegendItem()
item1.Label = "Item 1"
item1.MarkerFill = New SolidColorBrush(Colors.Blue)
radChart.DefaultView.ChartLegend.Items.Add(item1)
Dim item2 As New ChartLegendItem()
item2.Label = "Item 2"
item2.MarkerFill = New SolidColorBrush(Colors.Green)
radChart.DefaultView.ChartLegend.Items.Add(item2)
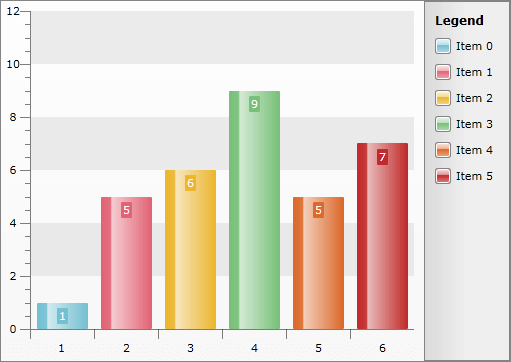
And here is the result:

Legend Display Modes
The SeriesDefinitions expose the LegendDisplayMode property, which allows you to specify the way in which the Legend gets displayed. You can choose between three values:
DataPointLabel - this will display an item for each DataPoint in your series and each series item will be marked with a different color.
None - this will display no items in the legend.
SeriesLabel - this will display an item for each series in your RadChart.
The default value is different depending on the type of the series.
Here is an example of how the legend looks, when the LegednDisplayMode of the DefaultSeriesDeifinition is set to DataPointLabel.
When using dynamic data and you want the LegednDisplayMode to be set to DataPointLabel, you have to create an ItemMapping for the LegendLabel property of the DataPoint. More information about ItemMappings can be found here.
public LegendDisplayModeSample()
{
    InitializeComponent();
    this.radChart.ItemsSource = new int[] { 1, 5, 6, 9, 5, 7 };
    this.radChart.DefaultSeriesDefinition.LegendDisplayMode = LegendDisplayMode.SeriesLabel;
}
Public Sub New()
    InitializeComponent()
    Me.radChart.ItemsSource = New Integer() {1, 5, 6, 9, 5, 7}
    Me.radChart.DefaultSeriesDefinition.LegendDisplayMode = LegendDisplayMode.SeriesLabel
End Sub

Legend Positioning
You are able to specify the position of the Legend by just setting the ChartLegendPosition property of the ChartDefaultView. It can have one of the following values:
Bottom - places the legend at the bottom of the RadChart.
Left - places the legend at the left of the RadChart.
Right - places the legend at the right of the RadChart. (default)
Top - places the legend at the top of the RadChart.
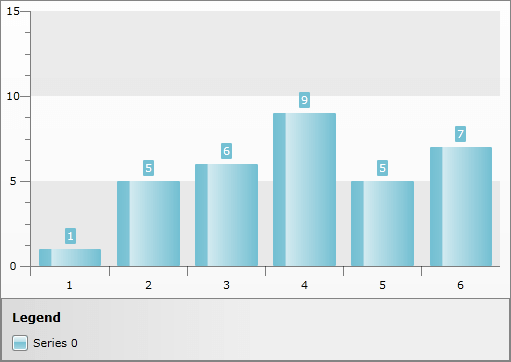
Here is an example:
this.radChart.DefaultView.ChartLegendPosition = Dock.Bottom;
Me.radChart.DefaultView.ChartLegendPosition = Dock.Bottom

Legend Items Shape
You are able to specify the shape of the Legend Item Markers just by setting the LegendItemMarkerShape property of the ChartLegend. It can be assigned to the following shapes:
Line
Circle
Diamond
Hexagon
Square
SquareRounded (default)
StarEightRay
StarFiveRay
Triangle
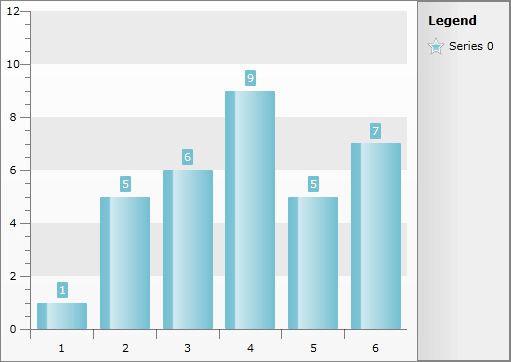
Here is an example:
this.radChart.DefaultView.ChartLegend.LegendItemMarkerShape = MarkerShape.StarFiveRay;
Me.radChart.DefaultView.ChartLegend.LegendItemMarkerShape = MarkerShape.StarFiveRay

Reverse Legend Items Order
There are scenarios where you would like to have the Legend Items displayed in reverse order. For example when you have a Horizontal Bar Series the series will be displayed in the Legend in the way they are populated. The bottom Serie will appear first on the Legend and the topmost will be last in the Legend. For such scenarios RadChart exposes a ReverseLegendItemsOrder boolean property to reverse the Legend Items order as its name implies.