Aggregates
RadTreeList provides the possibility to display column aggregates.The calculated total values are displayed in the footer item at the end of each level.
Below you can find a list of the available aggregate functions:
Avg
Count
CountDistinct
First
Last
Max
Min
Sum
You can set the Aggregate property of a bound column to the function that you want to be used in calculating the aggregated value. Then just set ShowFooter="true" in the RadTreeList declaration to start showing aggregates. A footer will appear at the bottom of each level in the treelist showing the totals from the items in this level.
You can also specify the FooterAggregateFormatString property of the treelist column in order to format the text describing the total displayed in the footer.
Here follows example treelist declaration using the above mentioned properties:
<telerik:RadTreeList RenderMode="Lightweight" ID="RadTreeList1" runat="server" DataSourceID="SqlDataSource1"
AutoGenerateColumns="false" ParentDataKeyNames="ParentLocationID" AllowPaging="true"
PageSize="10" DataKeyNames="LocationID" AllowSorting="true" ShowFooter="true">
<HeaderStyle HorizontalAlign="Center" />
<Columns>
    <telerik:TreeListBoundColumn DataField="LocationID" UniqueName="LocationID" HeaderText="LocationID">
        <HeaderStyle Width="120px" />
    </telerik:TreeListBoundColumn>
    <telerik:TreeListBoundColumn DataField="LocationName" UniqueName="LocationName" HeaderText="LocationName"
        Aggregate="Count" FooterAggregateFormatString="Count: {0}">
        <HeaderStyle Width="200px" />
    </telerik:TreeListBoundColumn>
    <telerik:TreeListNumericColumn DataField="Population" UniqueName="Population" HeaderText="Population"
        HeaderStyle-Width="170px" DataFormatString="{0:n}" Aggregate="Sum" DataType="System.Double"
        FooterAggregateFormatString="Sum: {0:n}">
        <ItemStyle HorizontalAlign="Right" />
    </telerik:TreeListNumericColumn>
    <telerik:TreeListNumericColumn DataField="Area" UniqueName="Area" HeaderText="Area"
        Aggregate="Sum" HeaderStyle-Width="170px" DataFormatString="{0:n} km<sup>2</sup>"
        DataType="System.Double" FooterAggregateFormatString="Sum: {0:n} km<sup>2</sup>">
        <ItemStyle HorizontalAlign="Right" />
    </telerik:TreeListNumericColumn>
    <telerik:TreeListCalculatedColumn DataFields="Area, Population" Expression="{1} / {0}"
        HeaderText="Density (Ppl/km<sup>2</sup>)" DataFormatString="{0:n}" Aggregate="Avg"
        FooterAggregateFormatString="Average: {0:n}">
        <ItemStyle HorizontalAlign="Right" />
    </telerik:TreeListCalculatedColumn>
    <telerik:TreeListBoundColumn DataField="ParentLocationID" UniqueName="ParentLocationID"
        Visible="false" HeaderText="ParentLocationID" />
</Columns>
</telerik:RadTreeList>
The result from these settings would look like this:
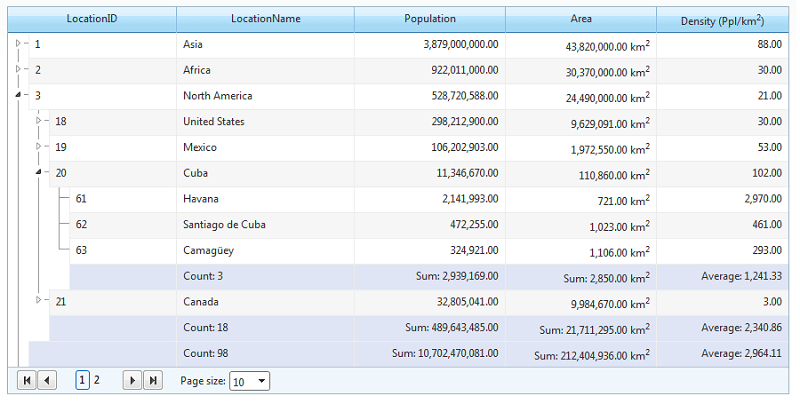
Limitations
The footer at the root level shows the aggregated values for all items inside the control's resolved datasource.
This also means that aggregates are not available with load on demand because the data source of the control is not fully resolved.