Getting Started with the Diagram
This tutorial explains how to set up the Telerik UI for ASP.NET MVC Diagram and highlights the major steps in the configuration of the component.
You will declare a view model for the Diagram's shapes and connections, initialize the UI component by adding a connection and shape data sources and configure the layout of the component. To make the Diagram editable, you will configure the CRUD operations. Finally, you will handle a Diagram JavaScript event and reference an existing instance of the component.
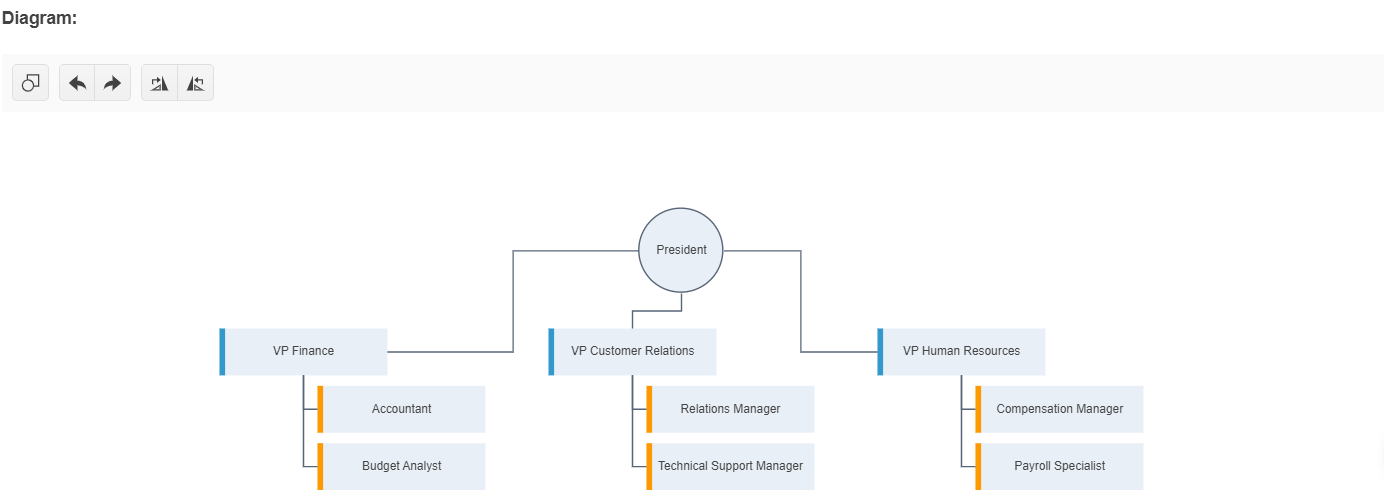
After completing this guide, you will achieve the following results:
Prerequisites
To successfully complete the tutorial, you need a project that is already configured to use the Telerik UI for ASP.NET MVC components:
To create a new pre-configured project for the Telerik UI for ASP.NET MVC components, you can use a project template.
To manually configure an existing project by using NuGet, see the Adding Telerik UI through NuGet.
1. Prepare the CSHTML File
The first step is to add the required directives at the top of the .cshtml document:
-
To use the Telerik UI for ASP.NET MVC HtmlHelpers:
@using Kendo.Mvc.UI
Optionally, you can structure the document by adding the desired HTML elements like headings, divs, paragraphs, and others.
2. Declare the View Models
Declare the Shape an Connection view models.
    public partial class OrgChartShape
    {
        public int Id { get; set; }
        public string Color { get; set; }
        public string JobTitle { get; set; }
    }
    public partial class OrgChartConnection
    {
        public long Id { get; set; }
        public long? FromPointX { get; set; }
        public long? FromPointY { get; set; }
        public long? FromShapeId { get; set; }
        public string Text { get; set; }
        public long? ToPointX { get; set; }
        public long? ToPointY { get; set; }
        public long? ToShapeId { get; set; }
    }
3. Initialize the Diagram
Use the Diagram HtmlHelper to add the component to a page and set some of its options.
- Use the
Name()configuration method to assign a name to the instance of the helper—this is mandatory as its value is used for theidand thenameattributes of the Diagram element. - Add the
DataSource()configuration option, configure theShapeDataSourceandConnectionsDataSource, and set the end points for the CRUD operations. - Customize the appearance of the Diagram.
    @(Html.Kendo().Diagram<OrgChartShape, OrgChartConnection>()
              .Name("diagram")
              .DataSource(d => d
                  .ShapeDataSource()
                  .Model(m =>
                  {
                      m.Id(s => s.Id);
                      m.Field(s => s.Id).Editable(false);
                      m.Field(s => s.JobTitle);
                      m.Field(s => s.Color);
                  })
                  .Read("ReadShapes", "DiagramData")
                  .Create("CreateShape", "DiagramData")
                  .Destroy("DestroyShape", "DiagramData")
                  .Update("UpdateShape", "DiagramData")
              )
              .ConnectionsDataSource(d => d
                  .Model(m =>
                  {
                      m.Id(c => c.Id);
                      m.Field(c => c.Id).Editable(false);
                      m.Field(c => c.Text).Editable(false);
                      m.From(c => c.FromShapeId);
                      m.To(c => c.ToShapeId);
                      m.FromX(c => c.FromPointX);
                      m.FromY(c => c.FromPointY);
                      m.ToX(c => c.ToPointX);
                      m.ToY(c => c.ToPointY);
                  })
                  .Read("ReadConnections", "DiagramData")
                  .Create("CreateConnection", "DiagramData")
                  .Destroy("DestroyConnection", "DiagramData")
                  .Update("UpdateConnection", "DiagramData")
              )
              .Layout(l => l
                  .Type(DiagramLayoutType.Tree)
                  .Subtype(DiagramLayoutSubtype.Tipover)
                  .UnderneathHorizontalOffset(140)
              )
              .ShapeDefaults(sd => sd
                  .Visual("visualTemplate")
                  .Content(c => c
                      .Template("#= dataItem.JobTitle #")
                      .FontSize(17)
                      .Color("#444")
                  )
              )
              .ConnectionDefaults(cd => cd
                  .Stroke(s => s
                      .Color("#586477")
                      .Width(2)
                  )
              )
              .HtmlAttributes(new { style = "height: 600px;" })
    )
    <script>
        function visualTemplate(options) {
            var dataviz = kendo.dataviz;
            var g = new dataviz.diagram.Group();
            var dataItem = options.dataItem;

            if (dataItem.JobTitle === "President") {
                g.append(new dataviz.diagram.Circle({
                    radius: 60,
                    stroke: {
                        width: 2,
                        color: dataItem.Color || "#586477"
                    },
                    fill: "#e8eff7"
                }));
            } else {
                g.append(new dataviz.diagram.Rectangle({
                    width: 240,
                    height: 67,
                    stroke: {
                        width: 0
                    },
                    fill: "#e8eff7"
                }));

                g.append(new dataviz.diagram.Rectangle({
                    width: 8,
                    height: 67,
                    fill: dataItem.Color,
                    stroke: {
                        width: 0
                    }
                }));
            }

            return g;
        }

    </script>
4. Declare the CRUD Actions
In the DiagramData controller, declare the CRUD actions. Use the names of the actions you set in the DataSource configuration in the previous step.
    public class DiagramDataController : Controller
    {
        public static List<OrgDiagramShape> diagramShapes = new List<OrgDiagramShape>
        {
            new OrgDiagramShape() { Id = 1, Color = "", JobTitle = "President" },
            new OrgDiagramShape() { Id = 2, Color = "#3399cc", JobTitle = "VP Finance" },
            new OrgDiagramShape() { Id = 3, Color = "#3399cc", JobTitle = "VP Customer Relations" },
            new OrgDiagramShape() { Id = 4, Color = "#3399cc", JobTitle = "VP Human Resources" },
            new OrgDiagramShape() { Id = 5, Color = "#ff9900", JobTitle = "Accountant" },
            new OrgDiagramShape() { Id = 6, Color = "#ff9900", JobTitle = "Budget Analyst" },
            new OrgDiagramShape() { Id = 7, Color = "#ff9900", JobTitle = "Relations Manager" },
            new OrgDiagramShape() { Id = 8, Color = "#ff9900", JobTitle = "Technical Support Manager" },
            new OrgDiagramShape() { Id = 9, Color = "#ff9900", JobTitle = "Compensation Manager" },
            new OrgDiagramShape() { Id = 10, Color = "#ff9900", JobTitle = "Payroll Specialist" }
        };

        public static List<OrgDiagramConnection> diagramConnections = new List<OrgDiagramConnection>
        {
            new OrgDiagramConnection() { Id = 1, FromShapeId = 1, ToShapeId = 2 },
            new OrgDiagramConnection() { Id = 2, FromShapeId = 1, ToShapeId = 3 },
            new OrgDiagramConnection() { Id = 3, FromShapeId = 1, ToShapeId = 4 },
            new OrgDiagramConnection() { Id = 4, FromShapeId = 2, ToShapeId = 5 },
            new OrgDiagramConnection() { Id = 5, FromShapeId = 2, ToShapeId = 6 },
            new OrgDiagramConnection() { Id = 6, FromShapeId = 3, ToShapeId = 7 },
            new OrgDiagramConnection() { Id = 7, FromShapeId = 3, ToShapeId = 8 },
            new OrgDiagramConnection() { Id = 8, FromShapeId = 4, ToShapeId = 9 },
            new OrgDiagramConnection() { Id = 9, FromShapeId = 4, ToShapeId = 10 }
        };

        public IActionResult Index()
        {
            return View();
        }

        public IActionResult ReadShapes([DataSourceRequest] DataSourceRequest request)
        {
            return Json(diagramShapes.ToDataSourceResult(request));
        }

        public IActionResult CreateShape([DataSourceRequest] DataSourceRequest request, OrgDiagramShape shape)
        {
            // Update the id field.
            return Json(new[] { shape }.ToDataSourceResult(request, ModelState));
        }
        public IActionResult UpdateShape([DataSourceRequest] DataSourceRequest request, OrgDiagramShape shape)
        {
            // Custom Update.
            return Json(new[] { shape }.ToDataSourceResult(request, ModelState));
        }
        public IActionResult DestroyShape([DataSourceRequest] DataSourceRequest request, OrgDiagramShape shape)
        {
            diagramShapes.Remove(shape);
            return Json(new[] { shape }.ToDataSourceResult(request, ModelState));
        }

        public IActionResult ReadConnections([DataSourceRequest] DataSourceRequest request)
        {
            return Json(diagramConnections.ToDataSourceResult(request));
        }

        public IActionResult CreateConnection([DataSourceRequest] DataSourceRequest request, OrgDiagramConnection connection)
        {
            // Update the id field.
            return Json(new[] { connection }.ToDataSourceResult(request, ModelState));
        }

        public IActionResult UpdateConnection([DataSourceRequest] DataSourceRequest request, OrgDiagramConnection connection)
        {
            // Custom Update
            return Json(new[] { connection }.ToDataSourceResult(request, ModelState));
        }

        public IActionResult DestroyConnection([DataSourceRequest] DataSourceRequest request, OrgDiagramConnection connection)
        {
            // Custom Remove
            diagramConnections.Remove(connection);
            return Json(new[] { connection }.ToDataSourceResult(request, ModelState));
        }
    }
5. Handle a Diagram Event
The Diagram exposes a variety of client-side events that you can explicitly handle to alter the components's built-in functionality as per your requirements. In this tutorial, you will use the DataBound event to bring in the previously declared shapes within the boundaries of the component by using the bringIntoView() client-side method.
    @(Html.Kendo().Diagram<OrgChartShape, OrgChartConnection>()
              .Name("diagram")
              .DataSource(d => d
                  .ShapeDataSource()
                  .Model(m =>
                  {
                      m.Id(s => s.Id);
                      m.Field(s => s.Id).Editable(false);
                      m.Field(s => s.JobTitle);
                      m.Field(s => s.Color);
                  })
                  .Read("ReadShapes", "DiagramData")
                  .Create("CreateShape", "DiagramData")
                  .Destroy("DestroyShape", "DiagramData")
                  .Update("UpdateShape", "DiagramData")
              )
              .ConnectionsDataSource(d => d
                  .Model(m =>
                  {
                      m.Id(c => c.Id);
                      m.Field(c => c.Id).Editable(false);
                      m.Field(c => c.Text).Editable(false);
                      m.From(c => c.FromShapeId);
                      m.To(c => c.ToShapeId);
                      m.FromX(c => c.FromPointX);
                      m.FromY(c => c.FromPointY);
                      m.ToX(c => c.ToPointX);
                      m.ToY(c => c.ToPointY);
                  })
                  .Read("ReadConnections", "DiagramData")
                  .Create("CreateConnection", "DiagramData")
                  .Destroy("DestroyConnection", "DiagramData")
                  .Update("UpdateConnection", "DiagramData")
              )
              .Events(e => e.DataBound("onDataBound"))
              .Layout(l => l
                  .Type(DiagramLayoutType.Tree)
                  .Subtype(DiagramLayoutSubtype.Tipover)
                  .UnderneathHorizontalOffset(140)
              )
              .ShapeDefaults(sd => sd
                  .Visual("visualTemplate")
                  .Content(c => c
                      .Template("#= dataItem.JobTitle #")
                      .FontSize(17)
                      .Color("#444")
                  )
              )
              .ConnectionDefaults(cd => cd
                  .Stroke(s => s
                      .Color("#586477")
                      .Width(2)
                  )
              )
              .HtmlAttributes(new { style = "height: 600px;" })
    )
    <script>
        function visualTemplate(options) {
            var dataviz = kendo.dataviz;
            var g = new dataviz.diagram.Group();
            var dataItem = options.dataItem;

            if (dataItem.JobTitle === "President") {
                g.append(new dataviz.diagram.Circle({
                    radius: 60,
                    stroke: {
                        width: 2,
                        color: dataItem.Color || "#586477"
                    },
                    fill: "#e8eff7"
                }));
            } else {
                g.append(new dataviz.diagram.Rectangle({
                    width: 240,
                    height: 67,
                    stroke: {
                        width: 0
                    },
                    fill: "#e8eff7"
                }));

                g.append(new dataviz.diagram.Rectangle({
                    width: 8,
                    height: 67,
                    fill: dataItem.Color,
                    stroke: {
                        width: 0
                    }
                }));
            }

            return g;
        }

        function onDataBound(e) {
            var that = this;
            setTimeout(function () {
                that.bringIntoView(that.shapes);
            }, 0);
        }
    </script>
(Optional) Reference Existing Diagram Instances
Referencing existing instances allows you to build on top of their configuration. To reference an existing Diagram instance, use the jQuery.data() method:
-
Use the
idattribute of the component instance to establish a reference.<script> var diagramReference = $("#diagram").data("kendoDiagram"); // diagramReference is a reference to the existing instance of the helper. </script> -
Use the Diagram client-side API to control the behavior of the widget. In this example, you will bring the Diagram into focus by using the
focusmethod.<script> var diagramReference = $("#diagram").data("kendoDiagram"); // diagramReference is a reference to the existing instance of the helper. diagramReference.focus(); // Bring the Diagram into focus. </script>