Radar Area Series
Overview
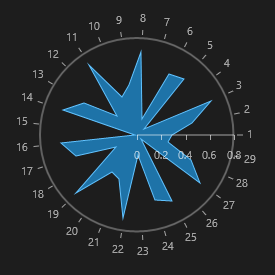
When using RadarAreaSeries the data points are connected with straight line segments that enclose an area that may be optionally stroked and/or filled as shown on the image below:
Properties
RadarAreaSeries class inherits from the RadarLineSeries class - See the inherited properties.
- Fill (Brush): Gets or sets the Brush that defines the interior of the area.
Example
Here's an example of how to create a RadCartesianChart with RadarAreaSeries:
-
First, create a class for the sample data:
public class Data { public double Value { get; set; } public double Category { get; set; } } -
Then create the sample data:
List<Data> data = new List<Data>(); for (double i = 1; i < 30; i += 1) { data.Add(new Data() { Category = i, Value = ((0.7) * Math.Cos(20 * i)) }); } this.polarChart.DataContext = data; -
Finally, create the chart in XAML.
<telerikChart:RadPolarChart x:Name="polarChart">
    <telerikChart:RadPolarChart.PolarAxis>
        <telerikChart:PolarAxis/>
    </telerikChart:RadPolarChart.PolarAxis>
    <telerikChart:RadPolarChart.RadialAxis>
        <telerikChart:NumericalRadialAxis/>
    </telerikChart:RadPolarChart.RadialAxis>

    <telerikChart:RadarAreaSeries ItemsSource="{Binding}">
        <telerikChart:RadarAreaSeries.ValueBinding>
            <telerikChart:PropertyNameDataPointBinding PropertyName="Value"/>
        </telerikChart:RadarAreaSeries.ValueBinding>
        <telerikChart:RadarAreaSeries.CategoryBinding>
            <telerikChart:PropertyNameDataPointBinding PropertyName="Category"/>
        </telerikChart:RadarAreaSeries.CategoryBinding>
    </telerikChart:RadarAreaSeries>
</telerikChart:RadPolarChart>