Bar Series
Overview
Data points are represented by a box where the height (width) of the box is the distance between the point’s numerical value and the categorical axis that plots the point. Bars may be either horizontal or vertical depending on whether the categorical axis is specified as an X-axis or as an Y-axis.
Properties
BarSeries class inherits from the CategoricalSeries class - See the inherited properties.
- PaletteMode: Gets or sets the target type to that chart palette will be applied to. The available types are:
- Series: Applies the palette per series.
- DataPoint: Applies the palette per points.
Example
Here's an example of how to create a RadCartesianChart with BarSeries.
-
First, create a class for the sample data.
public class Data { public string Category { get; set; } public double Value { get; set; } } -
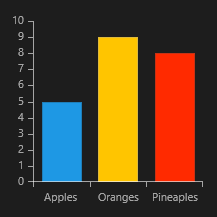
Then create the sample data.
List<Data> data = new List<Data>(); data.Add(new Data() { Category = "Apples", Value = 5 }); data.Add(new Data() { Category = "Oranges", Value = 9 }); data.Add(new Data() { Category = "Pineaples", Value = 8 }); this.barSeries.DataContext = data; -
Finally, create the chart using XAML.
<telerikChart:RadCartesianChart x:Name="barSeries" PaletteName="DefaultLight">
    <telerikChart:RadCartesianChart.VerticalAxis>
        <telerikChart:LinearAxis/>
    </telerikChart:RadCartesianChart.VerticalAxis>
    <telerikChart:RadCartesianChart.HorizontalAxis>
        <telerikChart:CategoricalAxis/>
    </telerikChart:RadCartesianChart.HorizontalAxis>

    <telerikChart:BarSeries ItemsSource="{Binding}" PaletteMode="DataPoint">
        <telerikChart:BarSeries.CategoryBinding>
            <telerikChart:PropertyNameDataPointBinding PropertyName="Category"/>
        </telerikChart:BarSeries.CategoryBinding>
        <telerikChart:BarSeries.ValueBinding>
            <telerikChart:PropertyNameDataPointBinding PropertyName="Value"/>
        </telerikChart:BarSeries.ValueBinding>
    </telerikChart:BarSeries>
</telerikChart:RadCartesianChart>