Overview
RadChart plots data points in a coordinate system defined by its two axes. Instead of having one axis type that does hundreds of things, we have a hierarchy of axes where each concrete axis type expose particular functionality.
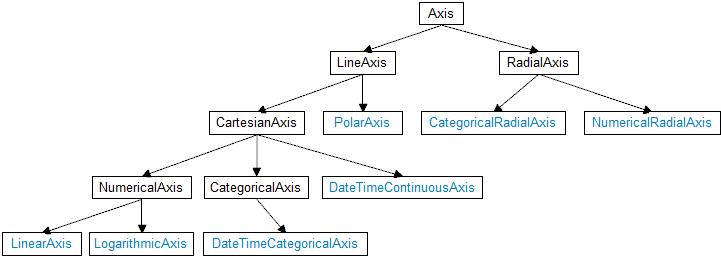
The predefined axis types are:
- LinearAxis
- LogarithmicAxis
- CategoricalAxis
- DateTimeAxis
- PolarAxis
- NumericalRadialAxis
- CategoricalRadialAxis
The common axis functionality is encapsulated by the abstract Axis class and is responsible for displaying ticks that simply mark values on the axis at fixed positions. The axis also displays labels that are used to provide a visualization of the values at some or all of the ticks. The default visualization of the labels is text and the default visuals created internally are text blocks.
Properties
Here is a list with all the properties exposed by the base axis type:
-
LabelStyle (Style): Defines the appearance of the internally created TextBlock instances, used to visualize each label on the axis. The Style should target the TextBlock type.
The following code demonstrates how to provide a custom Margin value for to each TextBlock:
<telerikChart:CategoricalAxis> <telerikChart:CategoricalAxis.LabelStyle> <Style TargetType="TextBlock"> <Setter Property="Margin" Value="10"/> </Style> </telerikChart:CategoricalAxis.LabelStyle> </telerikChart:CategoricalAxis> -
LabelTemplate (DataTemplate): Provides a mechanism for specifying a custom visual representation of each label on the axis. Instead of TextBlock instances, the axis will create ContentPresenter instances, and will pass the specified template as a ContentTemplate to each presenter.
Here is a code that demonstrates setting up a custom template:
<telerikChart:LinearAxis>
    <telerikChart:LinearAxis.LabelTemplate>
        <DataTemplate>
            <Border BorderBrush="Orange" BorderThickness="2">
                <TextBlock Text="{Binding}" Margin="4"/>
            </Border>
        </DataTemplate>
    </telerikChart:LinearAxis.LabelTemplate>
</telerikChart:LinearAxis>
Using the LabelTemplate property together with ContentPresenters will degrade the performance of the chart as more complex visual trees are created.
-
LabelTemplateSelector (DataTemplateSelector): Provides additional flexibility over the LabelTemplate property. The selector allows you to specify different templates for different labels, based on the context of your data.
The following code demonstrates how to create a custom template selector:
<telerikChart:CategoricalAxis>
    <telerikChart:CategoricalAxis.LabelTemplateSelector>
        <local:AxisLabelTemplateSelector>
            <local:AxisLabelTemplateSelector.Template1>
                <DataTemplate>
                    <TextBlock Text="{Binding}" Foreground="Orange"/>
                </DataTemplate>
            </local:AxisLabelTemplateSelector.Template1>
            <local:AxisLabelTemplateSelector.Template2>
                <DataTemplate>
                    <TextBlock Text="{Binding}" Foreground="Red"/>
                </DataTemplate>
            </local:AxisLabelTemplateSelector.Template2>
        </local:AxisLabelTemplateSelector>
    </telerikChart:CategoricalAxis.LabelTemplateSelector>
</telerikChart:CategoricalAxis>
And here is the code-behind that declares the selector:
public class AxisLabelTemplateSelector : DataTemplateSelector
{
    public DataTemplate Template1 { get; set; }

    public DataTemplate Template2 { get; set; }

    protected override DataTemplate SelectTemplateCore(object item, DependencyObject container)
    {
        int labelIndex = (int)item;
        return (labelIndex % 2) == 0 ? this.Template1 : this.Template2;
    }
}
The item parameter of the SelectTemplateCore method is the index of the label on the axis.
-
MajorTickStyle (Style): Defines the appearance of the internally created Rectangle instances, used to visualize each major tick on the axis. The Style should target the Rectangle type.
The following code demonstrates how to provide a custom Fill value to each Rectangle:
<telerikChart:LinearAxis> <telerikChart:LinearAxis.MajorTickStyle> <Style TargetType="Rectangle"> <Setter Property="Fill" Value="Orange"/> </Style> </telerikChart:LinearAxis.MajorTickStyle> </telerikChart:LinearAxis> -
MajorTickTemplate (DataTemplate): Provides a mechanism for specifying a custom visual representation for each major tick on the axis. Instead of Rectangle instances, the axis will create ContentPresenter instances and will pass the specified DataTemplate as a ContentTemplate to each presenter.
Here is a code snippet that demonstrates setting up a custom template:
<telerikChart:LinearAxis>
    <telerikChart:LinearAxis.LabelTemplate>
        <DataTemplate>
            <Border BorderBrush="Orange" BorderThickness="2">
                <TextBlock Text="{Binding}" Margin="4"/>
            </Border>
        </DataTemplate>
    </telerikChart:LinearAxis.LabelTemplate>
</telerikChart:LinearAxis>
Using the MajorTickTemplate property together with ContentPresenters will degrade the performance of the chart as more complex visual trees are created.
-
LineStyle (Style): Defines the appearance of the axis line. For a straight line axes the visual is a Line shape, while for a radial axes the visual is an Ellipse shape.
Here is a code snippet that demonstrates setting-up a custom style:
<telerikChart:CategoricalAxis> <telerikChart:CategoricalAxis.LineStyle> <Style TargetType="Line"> <Setter Property="Stroke" Value="AntiqueWhite"/> <Setter Property="StrokeDashArray" Value="2 2"/> </Style> </telerikChart:CategoricalAxis.LineStyle> </telerikChart:CategoricalAxis> -
Title (object): Provides additional information for the meaning of the axis in the context of your data. By default, the title is visualized by a TextBlock that gets automatically rotated for vertical axes.
The following code demonstrates how to specify a Title value:
<telerikChart:LinearAxis Title="Countries - Europe"/> -
TitleTemplate (DataTemplate): Provides a mechanism for changing the appearance of the axis' title.
The following code snippet demonstrates how to specify a custom TitleTemplate:
<telerikChart:CategoricalAxis> <telerikChart:CategoricalAxis.TitleTemplate> <DataTemplate> <Border BorderBrush="AntiqueWhite"> <TextBlock Text="{Binding}"/> </Border> </DataTemplate> </telerikChart:CategoricalAxis.TitleTemplate> </telerikChart:CategoricalAxis> -
LabelFormat (string): Allows axis labels to be formatted in a custom way. The String.Format method is internally used, so the property value passed should follow the syntax, expected by the runtime String.Format: {index[,alignment][ : formatString]}.
The following code demonstrates how to format the labels of a DateTimeCategoricalAxis to show the Year component of the associated date:
<telerikChart:DateTimeCategoricalAxis DateTimeComponent="Year" LabelFormat="{}{0,0:yyyy}"/> -
LabelFormatter (IContentFormatter): Allows a custom IContentFormatter instance to be used for formatting axis labels. This is useful in case context-sensitive format on a per-label basis is required.
The following code demonstrates how to create and assign a custom IContentFormatter instance:
<telerikChart:CategoricalAxis> <telerikChart:CategoricalAxis.LabelFormatter> <local:CustomLabelFormatter/> </telerikChart:CategoricalAxis.LabelFormatter> </telerikChart:CategoricalAxis> public class CustomLabelFormatter : IContentFormatter { public object Format(object owner, object content) { // The owner parameter is the Axis instance which labels are currently formatted var axis = owner as Axis; return content.ToString(); } } -
LabelFitMode: Specifies how labels that exceed axis bounding rectangle should be positioned. These are the available fit options:
- MultiLine: Labels are arranged into multiple lines, where adjacent overlapping labels are dropped on a new line.
- Rotate: Labels are rotated around their top-left corner by the degree - specified by the LabelRotationAngle property.
- LabelRotationAngle (double): Specifies the degrees used to rotate the labels when the LabelFitMode is set to Rotate.
- TickThickness (double): Defines the thickness of the ticks.
- LabelInterval (int): Defines a step used to position labels on the axis. The default value, 1, means there will be a label associated with each axis tick. Changing the value to 2, for example, means that there will be labels at tick index 1, 3, 5, etc.
- LabelOffset (int): Defines a zero-based index at which label generation starts. For example, setting 2 means those labels will start from the third axis tick.
- MajorTickOffset (int): Defines a zero-based index at which tick generation starts. This property will also affect axis labels as labels are created on a per major tick basis.
- LastLabelVisibility (Telerik.Charting.AxisLastLabelVisibility): Defines the behavior of the last axis label. By default, the plot area will be deflated to adapt the last label size, so that it fits within the whole area. Requires additional arrange pass once all the axes present are measured. You may turn this behavior off by passing Hidden or Clip values.
- ShowLabels (bool): Gets or sets a value indicating whether labels will be displayed on this axis.
LineAxis specific
- IsInverse (bool): Gets or sets a value that specifies whether the axis direction is inverted.
RadialAxis specific
- SweepDirection (SweepDirection): Gets or sets a value that specifies in which direction the axis will plot its data. This property does not affect the StartAngle property of the RadPolarChart.