Configuring Board's Rows and Columns
Boards in TeamPulse are quite flexible so that you can visualize your data in different ways.
They can be configured to display different intersections of data. For example, how many items I have in the current iteration in state In Progress.
Or how many bugs I have per iteration (for the last few iterations).
Board columns
TeamPulse offers four options for customizing board columns by: status, iteration, release or no columns.
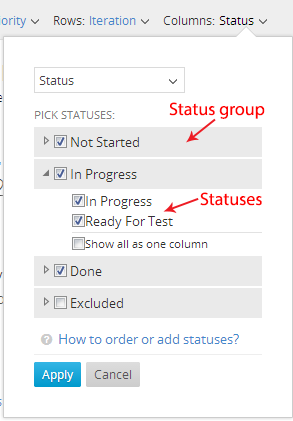
Columns by Status
When you choose columns by status the board will show columns for each status you have in your project. For example if you have the status “In Development” in that column you’ll see all items that are in the "In Development" state.

All statuses are taken from the project Advanced Settings. For every "EntityDefinition" in the project settings, there are four types of group statuses:
- UnexecutedStatuses
- InProgressStatuses
- DoneStatuses
- ExcludedStatuses
The board columns represent each status in these groups and will be shown in the board as a column.

How to combine columns
If you check the box “Show all as one column” all the statuses from the Group Statuses will be shown in one column.
How to reorder columns
To reorder columns you need to set the exact order of the statuses in each group status. For example to switch the “In Progress” column and “Ready For Test” column change:
<InProgressStatuses> In Progress, Ready For Test</InProgressStatuses>To:
<InProgressStatuses>Ready For Test, In Progress <InProgressStatuses/>You need to switch these for every "EntityDefinition" node.
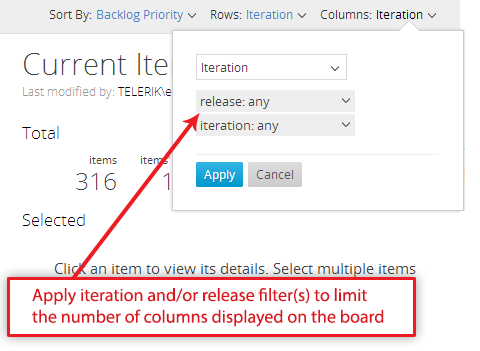
Columns by Iteration and Release
When you choose columns by iteration or release the board will show columns for each iteration you have in your project. However, you can filter the iterations to limit the number of columns on the board.
This is how the iteration columns look like:

By choosing columns by release the board will show columns for each release in your project and there is an option to filter the release to limit the number of columns on the board.

This is how the release columns look like:

The board will initially load only the first 8 columns. If you scroll to the right, an arrow button will appear for loading the next 8 columns.
No Columns
A board like this will display all items in one column as cards. If you ask yourself “Why would I need this?” the answer is that in this way you can see a lot more items on one screen than, for example, in the list view.
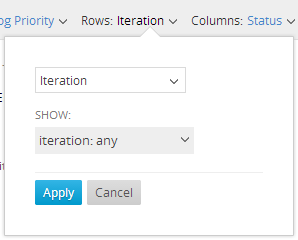
Board Rows
Rows by Iteration or Release
The board will have rows for each iteration(release) and on each row it will display the items for that iteration (release).
..will result in this:

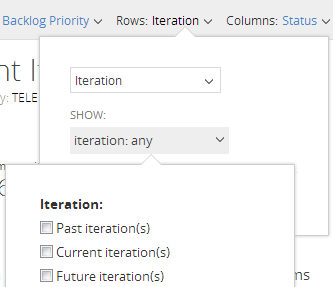
By default, the board will display all iterations(releases) as rows (even if you’ve applied filter by a specific subset of the items) but you can choose if you want to see only specific iterations(releases).
This gives you the opportunity to move items from iteration to iteration. If you are at the end of the current iteration you can use the board to move all items which were not completed to the next iteration. Just pick from the row configuration drop down the current and the next iteration so only they show up as rows in the grid.
Rows by parent item
That configuration is deprecated. It could be substituted by creating a board with rows by Relationship and "Relation type" filter by "Child". See the next section.
Rows by Relationship
The board will show rows for all items that match the selected rows filters (in Relationship column) and each row will display the items that have any type of relationship with that item.
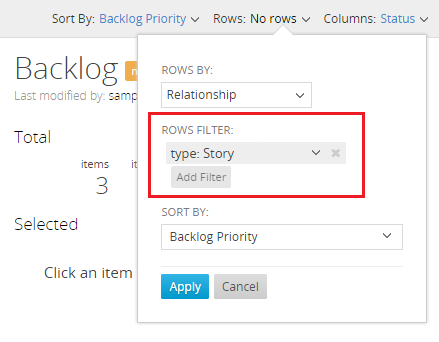
Cards with size of 4 or 5 that are displayed for each row show what is the type of the relationship between the item and the item for the row. You could choose which relationship types to see by adding a "Relation Type" filter. Note that this filter is available only on board view with rows by Relationship.
