Chart for Xamarin.iOS: Annotations
Annotations are visual elements that can be used to highlight certain areas on the plot area and denote statistical significance.
TKChart provides the following types of annotations:
TKChartGridLineAnnotationTKChartBandAnnotationTKChartCrossLineAnnotationTKChartBalloonAnnotationTKChartLayerAnnotationTKChartViewAnnotation
Adding annotations to the chart
TKChart contains an annotations collection and annotations can be added to the chart by calling the AddAnnotation method. The following code adds a horizontal grid line annotation in TKChart. The annotation requires an axis and a value in order to be initialized correctly.
chart.AddAnnotation (new TKChartGridLineAnnotation(new NSNumber(600), chart.XAxis));
The annotation visibility can be controlled by setting its Hidden property.
The annotation visual appearance can be changed by using its Style property.
Annotation types
Conceptually, there are three types of annotations - grid line, band and point annotations. Below is a comparison for each one depending on the scenario.
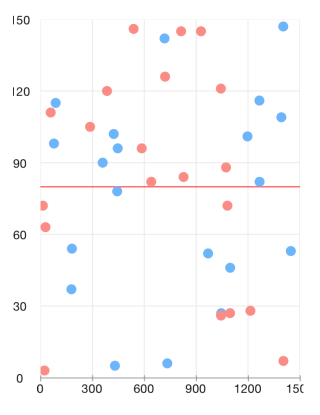
Grid line
The grid line annotation represents a vertical or horizontal line which crosses the entire plot area. It is specified by using the TKChartGridLineAnnotation.
The line color can be customized by using the annotation initializer:
chart.AddAnnotation (new TKChartGridLineAnnotation(new NSNumber(80), chart.YAxis, new TKStroke(UIColor.Red)));
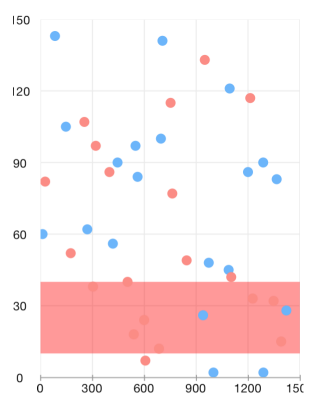
Plot band
The TKChartBandAnnotation is either horizontal or vertical strip, crossing its corresponding axis, specified by its Range property.
chart.AddAnnotation (new TKChartBandAnnotation(new TKRange(new NSNumber(10), new NSNumber(40)), chart.YAxis, new TKSolidFill(new UIColor (1, 0, 0, 0.4f)), null));
Point annotations
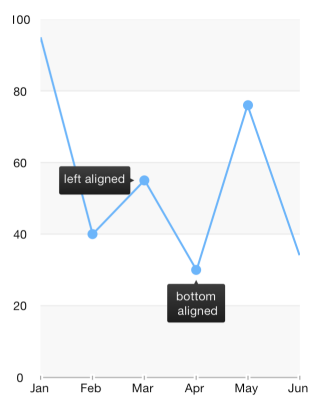
Point annotations render their content starting at specific position. Besides the position, a pixel based offset could be added to the point annotation by specifying the Offset property.
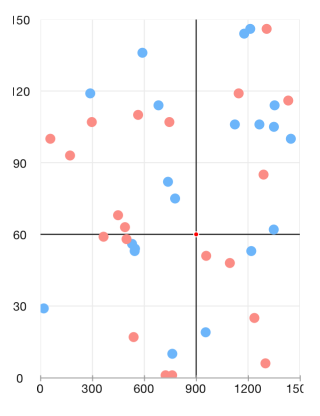
Cross line annotation
The TKChartCrossLineAnnotation is a point annotation which represents two crossing lines with a point at the crossing position.
chart.AddAnnotation (new TKChartCrossLineAnnotation(new NSNumber(900), new NSNumber(60), chart.Series[0]));
Balloon annotation
The TKChartBalloonAnnotation displays a balloon-like shape next to the position specified by its arguments. The VerticalAlign and HorizontalAlign properties allow to position the annotation precisely. The balloon will correct its position automatically if there is not enough space at the specified coordinates.
NSMutableParagraphStyle paragraphStyle = (NSMutableParagraphStyle)new NSParagraphStyle ().MutableCopy();
paragraphStyle.Alignment = UITextAlignment.Center;
NSMutableDictionary attributes = new NSMutableDictionary ();
attributes.Add (UIStringAttributeKey.ForegroundColor, UIColor.White);
attributes.Add (UIStringAttributeKey.ParagraphStyle, paragraphStyle);
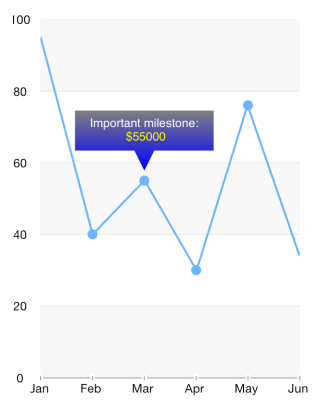
NSMutableAttributedString attributedText = new NSMutableAttributedString ("Important milestone:\n $55000", attributes);
attributedText.AddAttribute (UIStringAttributeKey.ForegroundColor, UIColor.Yellow, new NSRange (22, 6));
TKChartBalloonAnnotation balloon = new TKChartBalloonAnnotation (new NSString("Mar"), new NSNumber(55), series);
balloon.AttributedText = attributedText;
balloon.Style.DistanceFromPoint = 20;
balloon.Style.ArrowSize = new Size (10, 10);
chart.AddAnnotation (balloon);
The AttributedText property can be used to present formatted text with NSAttributedString.
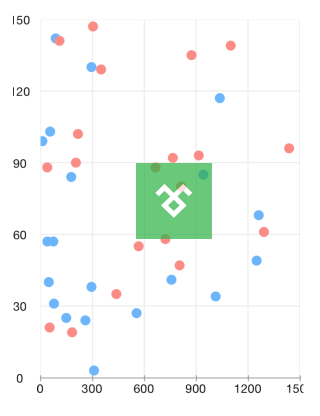
Layer and view annotations
The TKChartLayerAnnotation and TKChartViewAnnotations are also point annotations. Those allow positioning a layer or a view inside the chart. The following code will position an image at the center of the chart:
UIImageView imageView = new UIImageView ();
imageView.Image = UIImage.FromBundle ("logo.png");
imageView.Bounds = new CGRect (0, 0, imageView.Image.Size.Width, imageView.Image.Size.Height);
imageView.Alpha = 0.7f;
chart.AddAnnotation (new TKChartViewAnnotation(imageView, new NSNumber(550), new NSNumber(90), chart.Series[0]));