Overview
RadCartesianChart plots data points in a coordinate system defined by its two axes. Instead of having one axis type that does hundreds of things, we have a hierarchy of axes where each concrete axis type expose particular functionality.
The Axes is part of Telerik UI for Xamarin, a
professional grade UI component library for building modern and feature-rich applications. To try it out sign up for a free 30-day trial.
![]()
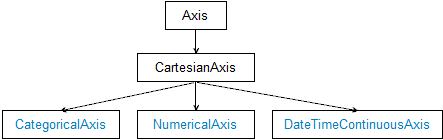
The predefined axis types are:
Common Axis Features
The common axis functionality is encapsulated by the abstract Axis class and is responsible for displaying ticks that simply mark values on the axis at fixed positions. The axis also displays labels that are used to provide a visualization of the values at some or all of the ticks. The default visualization of the labels is text and the default visuals created internally are text blocks. Here is a list with all the properties exposed by the base axis type.
Label Style and Position
You can customize the labels orientation and style with the following properties:
-
LabelFitMode: Specifies how labels that exceed axis bounding rectangle should be positioned. These are the available fit options:
- MultiLine: Arranges axis labels on multiple lines with each label on a different line than its neighbor labels.
- Rotate: Arranges the axis labels so that they are rotated some degrees around their top left corner.
- LabelFontSize: Specifies the font size of the labels.
- LabelTextColor: Specifies the color of the labels.
Example
<telerikChart:CategoricalAxis LabelFitMode="Rotate"
                              LabelFontSize="25"
                              LabelTextColor="#FFCC88CC"/>
Label Format
You can customize the labels text with the following properties:
-
LabelFormat: Provides a format string that will be used when converting the label value to string. Each axis type requires different format:
-
NumericalAxis: any numeric format like
"N","P2" -
DateTimeContinuousAxis: any date format like
"dd-MM-yy","HH:mm" -
CategoricalAxis:
"{0} items","{0:N}"
-
NumericalAxis: any numeric format like
- LabelFormatter: Specifies a custom formatter that implements the ILabelFormatter interface to apply a custom rule for setting each label text.
Example
Here is a quick snippet how you can set LabelFormat to a NumericalAxis:
<telerikChart:NumericalAxis LabelFormat="C"
                            MajorStep="0.5"
                            Minimum="-1"
                            Maximum="1" />
Label Formatter
The LabelFormatterBase
Example
public class DateLabelFormatter : LabelFormatterBase<DateTime>
{
    public override string FormatTypedValue(DateTime value)
    {
        if (value.Day == 1)
        {
            return value.Day + "st";
        }
        else if (value.Day == 2)
        {
            return value.Day + "nd";
        }
        else if (value.Day == 3)
        {
            return value.Day + "rd";
        }
        else
        {
            return value.Day + "th";
        }
    }
}
And you could apply it like this:
<telerikChart:DateTimeContinuousAxis LabelFitMode="Rotate"
                                     MajorStepUnit="Day">
    <telerikChart:DateTimeContinuousAxis.LabelFormatter>
        <local:DateLabelFormatter />
    </telerikChart:DateTimeContinuousAxis.LabelFormatter>
</telerikChart:DateTimeContinuousAxis>
Styling the Axis Line and Ticks
You can customize the appearance of the axis line and ticks with the following properties:
- MajorTickBackgroundColor: Specifies the major ticks color.
- MajorTickThickness: Specifies the thickness of the major ticks.
- LineColor: Specifies the color of the axis line.
- LineDashArray: Specifies the array used to create a dash line that will be applied to the axis line.
Example
    <telerikChart:NumericalAxis MajorTickBackgroundColor="#FFCC88CC"
                                MajorTickThickness="5"
                                LineColor="#FFCC88CC"/>
Location
You can specify the location of the axis:
- HorizontalLocation: Specifies the horizontal location of the axis. Applicable for vertical axes.
- VerticalLocation: Specifies the vertical location of the axis. Applicable for horizontal axes.
Example
<telerikChart:CategoricalAxis VerticalLocation="Top"/>