Radar Point Series
The RadarPointSeries are displayed on the chart as unconnected data points presented by an arbitrary Template.
Properties
RadarPointSeries class inherits from the PolarSeries class - See the inherited properties.
- DataPoints: Gets the collection of data points associated with the series.
- CategoryBinding: Gets or sets the binding that will be used by the Category property of the contained CategoricalDataPointBase in the DataPoints collection.
- CombineMode: Gets or sets the combination mode to be used when data points are plotted.
- StackGroupKey: Gets or sets the key that defines in which stack group this series will be included, if its CombineMode property is set to Stack or Stack100.
Example
Examples 1 and 2 show how to create a RadCartesianChart with a RadarPointSeries.
Example 1: Defining the model and populating with data
public sealed partial class MainPage : Page
{
    public MainPage()
    {
        this.InitializeComponent();

        List<Data> data = new List<Data>();
        for (double i = 1; i < 30; i += 1)
        {
            data.Add(new Data() { Category = i, Value = ((0.7) * Math.Cos(20 * i)) });
        }

        this.polarChart.DataContext = data;
    }
}

public class Data
{
    public double Value { get; set; }

    public double Category { get; set; }
}
Example 2: Defining the RadPolarChart and RadarPointSeries
<Grid xmlns:telerikChart="using:Telerik.UI.Xaml.Controls.Chart">
    <telerikChart:RadPolarChart x:Name="polarChart">
        <telerikChart:RadPolarChart.PolarAxis>
            <telerikChart:PolarAxis/>
        </telerikChart:RadPolarChart.PolarAxis>
        <telerikChart:RadPolarChart.RadialAxis>
            <telerikChart:CategoricalRadialAxis/>
        </telerikChart:RadPolarChart.RadialAxis>

        <telerikChart:RadarPointSeries ItemsSource="{Binding}">
            <telerikChart:RadarPointSeries.ValueBinding>
                <telerikChart:PropertyNameDataPointBinding PropertyName="Value"/>
            </telerikChart:RadarPointSeries.ValueBinding>
            <telerikChart:RadarPointSeries.CategoryBinding>
                <telerikChart:PropertyNameDataPointBinding PropertyName="Category"/>
            </telerikChart:RadarPointSeries.CategoryBinding>
        </telerikChart:RadarPointSeries>
    </telerikChart:RadPolarChart>
</Grid>
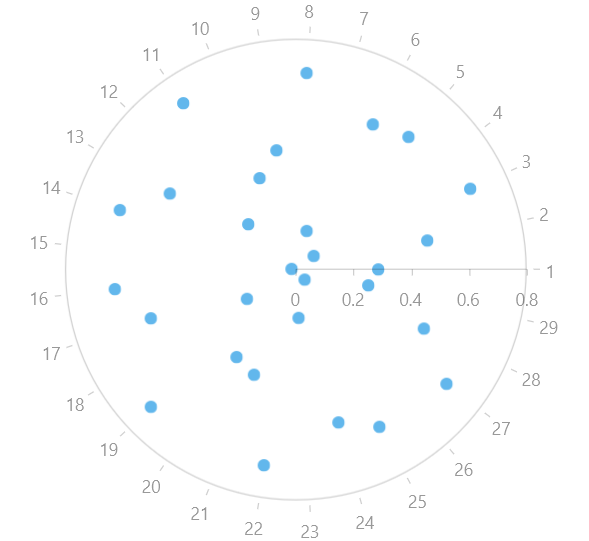
Figure 1: RadPolarChart and RadarPointSeries