Display Horizontal Bar Chart
RadChart allows a series to be rendered vertically as well as horizontally. A series position depends on the axes that you define. Thus in order to display a bar series horizontally, you need to define the category axis as a vertical axis, rather than a horizontal axis. Define a Bar Chart with a Horizontal Series
The following example demonstrates how to create a RadCartesianChart with horizontal BarSeries.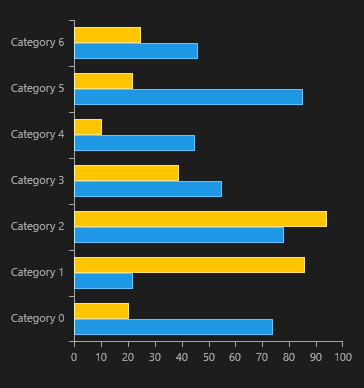
Create a bar chart with swapped axes.
<telerik:RadCartesianChart>
    <telerik:RadCartesianChart.HorizontalAxis>
        <telerik:LinearAxis/>
    </telerik:RadCartesianChart.HorizontalAxis>
    <telerik:RadCartesianChart.VerticalAxis>
        <telerik:CategoricalAxis/>
    </telerik:RadCartesianChart.VerticalAxis>
    <telerik:BarSeries CombineMode="Cluster" ItemsSource="{Binding Data1}">
        <telerik:BarSeries.ValueBinding>
            <telerik:PropertyNameDataPointBinding PropertyName="Value"/>
        </telerik:BarSeries.ValueBinding>
        <telerik:BarSeries.CategoryBinding>
            <telerik:PropertyNameDataPointBinding PropertyName="Category"/>
        </telerik:BarSeries.CategoryBinding>
    </telerik:BarSeries>
    <telerik:BarSeries CombineMode="Cluster" ItemsSource="{Binding Data2}">
        <telerik:BarSeries.ValueBinding>
            <telerik:PropertyNameDataPointBinding PropertyName="Value"/>
        </telerik:BarSeries.ValueBinding>
        <telerik:BarSeries.CategoryBinding>
            <telerik:PropertyNameDataPointBinding PropertyName="Category"/>
        </telerik:BarSeries.CategoryBinding>
    </telerik:BarSeries>
</telerik:RadCartesianChart>
Create a sample class for data:
public class SampleData
{
    public double Value { get; set; }
    public string Category { get; set; }
}
Create the view model:
public class SampleViewModel
{
    private Random r = new Random();

    public IEnumerable Data1 { get; private set; }
    public IEnumerable Data2 { get; private set; }


    public SampleViewModel()
    {
        this.Data1 = (from c in Enumerable.Range(0, 10)
                      select new SampleData
                      {
                          Category = "Category " + c,
                          Value = r.Next(10, 100)
                      }).ToList();

        this.Data2 = (from c in Enumerable.Range(0, 10)
                      select new SampleData
                      {
                          Category = "Category " + c,
                          Value = r.Next(10, 100)
                      }).ToList();
    }
}
Set the chart data context.
protected override void OnNavigatedTo(NavigationEventArgs e)
{
    this.DataContext = new SampleViewModel();
}