Scatter Spline Area Series
Overview
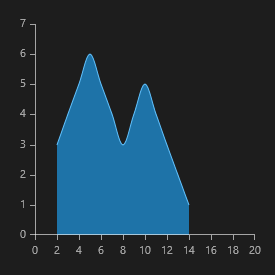
When using ScatterSplineAreaSeries the data points are connected with straight line segments and the area enclosed by the line and the coordinate axis may be optionally stroked and/or filled as shown on the image below.
ScatterSplineAreaSeries class inherits from the ScatterAreaSeries class - See the inherited properties.
Example
Here's an example of how to implement a RadCartesianChart with ScatterSplineAreaSeries.
-
First, create a class for the sample data.
public class Data { public double Category { get; set; } public double Value { get; set; } } -
Then, create the sample data.
List<Data> sampleData = new List<Data>(); sampleData.Add(new Data() { Category = 2, Value = 3 }); sampleData.Add(new Data() { Category = 3, Value = 4 }); sampleData.Add(new Data() { Category = 4, Value = 5 }); sampleData.Add(new Data() { Category = 5, Value = 6 }); sampleData.Add(new Data() { Category = 6, Value = 5 }); sampleData.Add(new Data() { Category = 7, Value = 4 }); sampleData.Add(new Data() { Category = 8, Value = 3 }); sampleData.Add(new Data() { Category = 9, Value = 4 }); sampleData.Add(new Data() { Category = 10, Value = 5 }); sampleData.Add(new Data() { Category = 11, Value = 4 }); sampleData.Add(new Data() { Category = 12, Value = 3 }); sampleData.Add(new Data() { Category = 13, Value = 2 }); sampleData.Add(new Data() { Category = 14, Value = 1 }); this.scatterSplineArea.DataContext = sampleData; -
Finally, create a chart using XAML.
<telerikChart:RadCartesianChart x:Name="scatterSplineAreaSeries">
    <telerikChart:RadCartesianChart.VerticalAxis>
        <telerikChart:LinearAxis/>
    </telerikChart:RadCartesianChart.VerticalAxis>
    <telerikChart:RadCartesianChart.HorizontalAxis>
        <telerikChart:LinearAxis/>
    </telerikChart:RadCartesianChart.HorizontalAxis>

    <telerikChart:ScatterSplineAreaSeries ItemsSource="{Binding}">
        <telerikChart:ScatterSplineAreaSeries.XValueBinding>
            <telerikChart:PropertyNameDataPointBinding PropertyName="XValue"/>
        </telerikChart:ScatterSplineAreaSeries.XValueBinding>
        <telerikChart:ScatterSplineAreaSeries.YValueBinding>
            <telerikChart:PropertyNameDataPointBinding PropertyName="YValue"/>
        </telerikChart:ScatterSplineAreaSeries.YValueBinding>
    </telerikChart:ScatterSplineAreaSeries>
</telerikChart:RadCartesianChart>