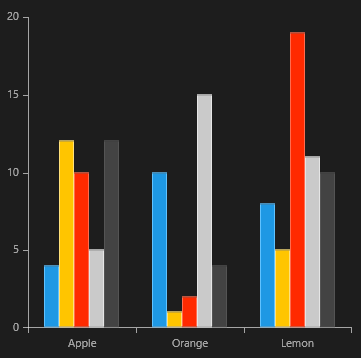
How to Generate a Dynamic Series Using a Collection of Collections
The following example demonstrates how to create a RadCartesianChart with a dynamic BarSeries.

-
First, create a class for the sample data.
public class Data { public double Value { get; set; } public string Category { get; set; } } -
Then create the sample data.
List<List<Data>> collection = new List<List<Data>>(); Random r = new Random(); for (int i = 0; i < 5; i++) { List<Data> data = new List<Data>(); data.Add(new Data { Category = "Apple", Value = r.Next(1, 20) }); data.Add(new Data { Category = "Orange", Value = r.Next(1, 20) }); data.Add(new Data { Category = "Lemon", Value = r.Next(1, 20) }); collection.Add(data); } provider.Source = collection; -
Finally, create the chart using XAML.
<telerikChart:RadCartesianChart PaletteName="DefaultDark" >
    <telerikChart:RadCartesianChart.HorizontalAxis>
        <telerikChart:CategoricalAxis/>
    </telerikChart:RadCartesianChart.HorizontalAxis>
    <telerikChart:RadCartesianChart.VerticalAxis>
        <telerikChart:LinearAxis/>
    </telerikChart:RadCartesianChart.VerticalAxis>
    <telerikChart:RadCartesianChart.SeriesProvider >
        <telerikChart:ChartSeriesProvider x:Name="provider" >
            <telerikChart:ChartSeriesProvider.SeriesDescriptors>
                <telerikChart:CategoricalSeriesDescriptor ValuePath="Value" CategoryPath="Category">
                    <telerikChart:CategoricalSeriesDescriptor.Style>
                        <Style TargetType="telerikChart:BarSeries">
                            <Setter Property="CombineMode" Value="Cluster"/>
                        </Style>
                    </telerikChart:CategoricalSeriesDescriptor.Style>
                </telerikChart:CategoricalSeriesDescriptor>
            </telerikChart:ChartSeriesProvider.SeriesDescriptors>
        </telerikChart:ChartSeriesProvider>
    </telerikChart:RadCartesianChart.SeriesProvider>
</telerikChart:RadCartesianChart>