Area Series
Overview
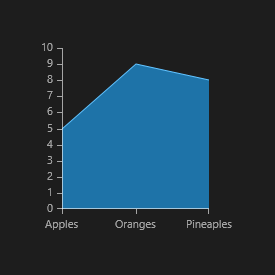
When using AreaSeries the data points are connected with straight line segments and the area enclosed by the line and the coordinate axis may be optionally stroked and/or filled as shown on the image below.
Properties
AreaSeries class inherits from the CategoricalStrokedSeries class - See the inherited properties.
-
StrokeMode: Gets or sets the mode that defines how the area is stroked. The available modes are:
- None: No outlining.
- LeftLine: The left border of the plot area defined by the data points and the horizontal axis is outlined.
- Points: The line that connects all points is outlined. This is the default mode.
- RightLine: The right border of the plot area defined by the data points and the horizontal axis is outlined.
- PlotLine: The bottom border of the plot area is outlined.
- LeftAndPoints: LeftLine and Points modes are enabled.
- RightAndPoints: RightLine and Points modes are enabled.
- AllButPlotLine: All modes except the PlotLine are enabled.
- All: All modes are enabled - the plot area is fully outlined.
- Fill (Brush): Gets or sets the style used to draw the Windows.UI.Xaml.Shapes.Polyline shape.
Example
Here's an example of how to create a RadCartesianChart with AreaSeries.
-
First, create a class for the sample data.
public class Data { public string Category { get; set; } public double Value { get; set; } } -
Then create the sample data.
List<Data> data = new List<Data>(); data.Add(new Data() { Category = "Apples", Value = 5 }); data.Add(new Data() { Category = "Oranges", Value = 9 }); data.Add(new Data() { Category = "Pineaples", Value = 8 }); this.areaSeries.DataContext = data; -
Finally, create the chart using XAML.
<telerikChart:RadCartesianChart x:Name="areaSeries" PaletteName="DefaultLight">
    <telerikChart:RadCartesianChart.VerticalAxis>
        <telerikChart:LinearAxis/>
    </telerikChart:RadCartesianChart.VerticalAxis>
    <telerikChart:RadCartesianChart.HorizontalAxis>
        <telerikChart:CategoricalAxis/>
    </telerikChart:RadCartesianChart.HorizontalAxis>

    <telerikChart:AreaSeries ItemsSource="{Binding}">
        <telerikChart:AreaSeries.CategoryBinding>
            <telerikChart:PropertyNameDataPointBinding PropertyName="Category"/>
        </telerikChart:AreaSeries.CategoryBinding>
        <telerikChart:AreaSeries.ValueBinding>
            <telerikChart:PropertyNameDataPointBinding PropertyName="Value"/>
        </telerikChart:AreaSeries.ValueBinding>
    </telerikChart:AreaSeries>
</telerikChart:RadCartesianChart>