Marked Zone Annotation
In this article the properties of the CartesianMarkedZoneAnnotation are described.
CartesianMarkedZoneAnnotation Properties
Add one or more sections with content
- ClipToPlotArea (bool): Gets or sets a value indicating whether the annotation will be clipped to the bounds of the plot area.
- Label (string): Gets or sets the label of the annotation.
- Stroke (Brush): Gets or sets the Brush that specifies how the shape outline is painted.
- StrokeThickness (double): Gets or sets the width of the shape stroke outline.
- StrokeDashArray (DoubleCollection): Gets or sets a collection of double values that indicates the pattern of dashes and gaps that is used to outline stroked series.
- Fill (Brush): Gets or sets the Brush that specifies how the shape fill is painted.
- HorizontalAxis (CartesianAxis): Gets or sets the horizontal axis that the annotation is associated with. If no axis is specified, the annotation will automatically use the chart's primary horizontal axis.
- VerticalAxis (CartesianAxis): Gets or sets the vertical axis that the annotation is associated with. If no axis is specified, the annotation will automatically use the chart's primary vertical axis.
- HorizontalFrom (object): Gets or sets the start horizontal coordinate of the annotation.
- HorizontalTo (object): Gets or sets the end horizontal coordinate of the annotation.
- VerticalFrom (object): Gets or sets the start vertical coordinate of the annotation.
- VerticalTo (object): Gets or sets the end vertical coordinate of the annotation.
Example of CartesianMarkedZoneAnnotation
This example demonstrates how to add CartesianMarkedZoneAnnotation to a RadCartesianChart.
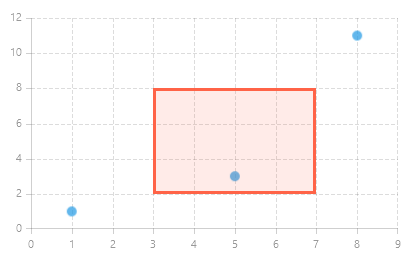
Here is the definition of the chart:
<telerikChart:RadCartesianChart Width="400" Height="250">
    <telerikChart:RadCartesianChart.Annotations>
        <telerikChart:CartesianMarkedZoneAnnotation HorizontalFrom="3" HorizontalTo="7"
                                                    VerticalFrom="2" VerticalTo="8"
                                                    Stroke="Tomato" StrokeThickness="3" Fill="#20FF6347"/>
    </telerikChart:RadCartesianChart.Annotations>

    <telerikChart:RadCartesianChart.HorizontalAxis>
        <telerikChart:LinearAxis />
    </telerikChart:RadCartesianChart.HorizontalAxis>
    <telerikChart:RadCartesianChart.VerticalAxis>
        <telerikChart:LinearAxis/>
    </telerikChart:RadCartesianChart.VerticalAxis>
    <telerikChart:ScatterPointSeries>
        <telerikChart:ScatterPointSeries.DataPoints>
            <telerikCharting:ScatterDataPoint XValue="1" YValue="1" />
            <telerikCharting:ScatterDataPoint XValue="5" YValue="3" />
            <telerikCharting:ScatterDataPoint XValue="8" YValue="11" />
        </telerikChart:ScatterPointSeries.DataPoints>
    </telerikChart:ScatterPointSeries>
    <telerikChart:RadCartesianChart.Grid>
        <telerikChart:CartesianChartGrid MajorLinesVisibility="XY" />
    </telerikChart:RadCartesianChart.Grid>
</telerikChart:RadCartesianChart>