Custom Annotation Types
There are two types of custom annotations depending on the type of the chart that uses them - CartesianCustomAnnotation and PolarCustomAnnotation. Below are described all properties that affect the custom annotations.
Custom Annotation Properties
- Common properties:
- Content: Gets or sets the content of the annotation.
- ContentTemplate: Defines the DataTemplate used to display the content of the annotation.
- HorizontalAlignment: Specifies where the content of the annotation will be rendered horizontally relative to the position associated with the annotation.
- VerticalAlignment: Specifies where the content of the annotation will be rendered vertically relative to the position associated with the annotation.
- HorizontalOffset: Specifies the horizontal pixel offset that is applied after the annotation is positioned on the plot (based on its Horizontal or Polar/Radial values). >This property is NOT applicable when the HorizontalAlignment property is set to Stretch.
- VerticalOffset: Specifies the vertical pixel offset that is applied after the annotation is positioned on the plot (based on its Vertical or Polar/Radial values). >This property is NOT applicable when the VerticalAlignment property is set to Stretch.
- CartesianCustomAnnotation specific properties:
- HorizontalAxis: Specifies the horizontal axis instance that will be used by the HorizontalValue property. By default the annotation takes the default HorizontalAxis defined by the chart.
- VerticalAxis: Specifies the vertical axis instance that will be used by the VerticalValue property. By default the annotation takes the default VerticalAxis defined by the chart.
- HorizontalValue: Specifies the place on the associated horizontal axis where the annotation is positioned. >When the axis is numerical (Linear or Logarithmic) a numeric value is expected, and when it is a CategoricalAxis - a category is expected.
- VerticalValue: Specifies the place on the associated vertical axis where the annotation is positioned. >When the axis is numerical (Linear or Logarithmic) a numeric value is expected, and when it is a CategoricalAxis - a category is expected.
- PolarCustomAnnotation specific properties:
- PolarValue: Specifies the place on the polar axis where the annotation is positioned.
- RadialValue: Specifies the place on the radial axis where the annotation is positioned. >When the radial axis is a NumericalRadialAxis a numeric value is expected, and when it is a CategoricalRadialAxis - a category is expected.
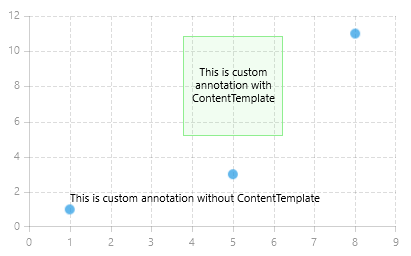
CartesianCustomAnnotation Example
This example demonstrates how to add CartesianCustomAnnotation with and without ContentTemplate to a RadCartesianChart.
Here is the definition of the chart:
<telerikChart:RadCartesianChart Width="400" Height="250">
    <telerikChart:RadCartesianChart.Annotations>
        <telerikChart:CartesianCustomAnnotation HorizontalValue="1" VerticalValue="2"
                                                Content="This is custom annotation without ContentTemplate" />
        <telerikChart:CartesianCustomAnnotation HorizontalValue="5" VerticalValue="8"
                                                HorizontalAlignment="Center" VerticalAlignment="Center">
            <telerikChart:CartesianCustomAnnotation.ContentTemplate>
                <DataTemplate>
                    <Border Width="100" Height="100" Background="#2090EE90"
                            BorderBrush="LightGreen" BorderThickness="1">
                        <TextBlock Text="This is custom annotation with ContentTemplate"
                                   TextWrapping="Wrap" TextAlignment="Center"
                                   VerticalAlignment="Center" HorizontalAlignment="Center"/>
                    </Border>
                </DataTemplate>
            </telerikChart:CartesianCustomAnnotation.ContentTemplate>
        </telerikChart:CartesianCustomAnnotation>
    </telerikChart:RadCartesianChart.Annotations>

    <telerikChart:RadCartesianChart.HorizontalAxis>
        <telerikChart:LinearAxis />
    </telerikChart:RadCartesianChart.HorizontalAxis>
    <telerikChart:RadCartesianChart.VerticalAxis>
        <telerikChart:LinearAxis/>
    </telerikChart:RadCartesianChart.VerticalAxis>
    <telerikChart:ScatterPointSeries>
        <telerikChart:ScatterPointSeries.DataPoints>
            <telerikCharting:ScatterDataPoint XValue="1" YValue="1" />
            <telerikCharting:ScatterDataPoint XValue="5" YValue="3" />
            <telerikCharting:ScatterDataPoint XValue="8" YValue="11" />
        </telerikChart:ScatterPointSeries.DataPoints>
    </telerikChart:ScatterPointSeries>
    <telerikChart:RadCartesianChart.Grid>
        <telerikChart:CartesianChartGrid MajorLinesVisibility="XY" />
    </telerikChart:RadCartesianChart.Grid>
</telerikChart:RadCartesianChart>
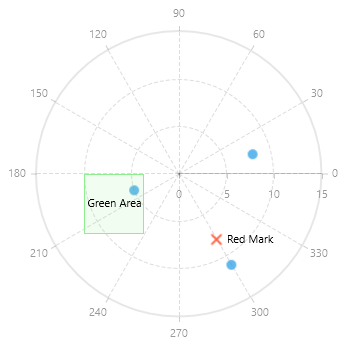
PolarCustomAnnotation Example
This example demonstrates how to add PolarCustomAnnotation with and without ContentTemplate to a RadPolarChart.
Here is the definition of the chart:
<telerikChart:RadPolarChart Height="350">
    <telerikChart:RadPolarChart.Annotations>
        <telerikChart:PolarCustomAnnotation PolarValue="8" RadialValue="300"
                                            HorizontalAlignment="Right"
                                            VerticalAlignment="Center"
                                            HorizontalOffset="10"
                                            Content="Red Mark"/>
        <telerikChart:PolarCustomAnnotation PolarValue="8" RadialValue="300"
                                            HorizontalAlignment="Center"
                                            VerticalAlignment="Center">
            <telerikChart:PolarCustomAnnotation.Content>
                <Path Stroke="Tomato" StrokeThickness="2">
                    <Path.Data>
                        <PathGeometry>
                            <PathGeometry.Figures>
                                <PathFigure StartPoint="0,0">
                                    <LineSegment Point="10,10"/>
                                </PathFigure>
                                <PathFigure StartPoint="0,10">
                                    <LineSegment Point="10,0"/>
                                </PathFigure>
                            </PathGeometry.Figures>
                        </PathGeometry>
                    </Path.Data>
                </Path>
            </telerikChart:PolarCustomAnnotation.Content>
        </telerikChart:PolarCustomAnnotation>
        <telerikChart:PolarCustomAnnotation PolarValue="10" RadialValue="180"
                                            HorizontalAlignment="Right"
                                            VerticalAlignment="Bottom">
            <telerikChart:PolarCustomAnnotation.ContentTemplate>
                <DataTemplate>
                    <Border Width="60" Height="60" Background="#2090EE90"
                            BorderBrush="LightGreen" BorderThickness="1">
                        <TextBlock Text="Green Area"
                                   TextWrapping="Wrap" TextAlignment="Center"
                                   VerticalAlignment="Center"
                                   HorizontalAlignment="Center"/>
                    </Border>
                </DataTemplate>
            </telerikChart:PolarCustomAnnotation.ContentTemplate>
        </telerikChart:PolarCustomAnnotation>
    </telerikChart:RadPolarChart.Annotations>

    <telerikChart:RadPolarChart.RadialAxis>
        <telerikChart:NumericalRadialAxis/>
    </telerikChart:RadPolarChart.RadialAxis>
    <telerikChart:RadPolarChart.PolarAxis>
        <telerikChart:PolarAxis/>
    </telerikChart:RadPolarChart.PolarAxis>
    <telerikChart:PolarPointSeries>
        <telerikChart:PolarPointSeries.DataPoints>
            <telerikCharting:PolarDataPoint Value="8" Angle="15" />
            <telerikCharting:PolarDataPoint Value="5" Angle="200" />
            <telerikCharting:PolarDataPoint Value="11" Angle="300" />
        </telerikChart:PolarPointSeries.DataPoints>
    </telerikChart:PolarPointSeries>
    <telerikChart:RadPolarChart.Grid>
        <telerikChart:PolarChartGrid GridLineVisibility="Both" />
    </telerikChart:RadPolarChart.Grid>
</telerikChart:RadPolarChart>