Visual Structure
The following topic describes all visual elements and terms used in a standard RadBulletGraph control.
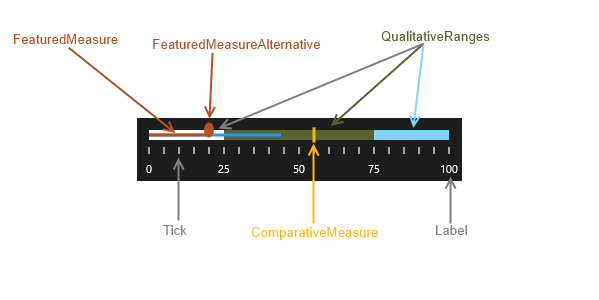
Legend
- Label: Visual representation of a value on the scale.
- Tick: Indicates the position of specific values on the scale.
- FeaturedMeasure: Represents the current progress in a RadBulletGraph.
- FeaturedMeasureAlternative: Indicates the EndValue of the Featured Measure. It is an Ellipse by default.
- ProjectedMeasure: Indicator that starts from the EndValue of the FeaturedMeasure.
- Comparative Measure: Marker indicating a certain threshold or value in the context of the data displayed.
- Qualitative Ranges: Different colored ranges, usually indicating bad, satisfactory and good areas.