Colorizer
The Colorizer feature of the VisualizationLayer allows you to colorize the MapShapeData objects inside it on the basis of a condition. For example, you can create maps that display shapes for each country with fill color depending on the population of the country.
In order to allow you to color the shapes depending on a condition, the VisualizationLayer class exposes the Colorizer property, which is of type IMapShapeColorizer.
Currently RadMap provides 2 colorizers out-of-the-box:
ColorMeasureScale - sets filling to the map shapes using value of one of the extended properties.
GraphColorizer - sets filling to the map shapes using the coloring of graph approach.
Using the ColorMeasureScale object
To use the ColorMeasureScale object in a layer, just set the Colorizer property of the respective layer to a new instance of it. Here is an example.
<telerik:RadMap x:Name="radMap" ZoomLevel="1">
    <telerik:RadMap.Provider>
        <telerik:EmptyProvider />
    </telerik:RadMap.Provider>
    <telerik:VisualizationLayer Name="visualizationLayer">
        <telerik:VisualizationLayer.Colorizer>
            <telerik:ColorMeasureScale />
        </telerik:VisualizationLayer.Colorizer>
    </telerik:VisualizationLayer>
</telerik:RadMap>
Extended Data Property
The ColorMeasureScale object colors the MapShapeData objects inside a layer on the basis of a value. This value should be specified through the ExtendedData for the MapShapeData object.
The Extended Data represents a set of properties and their respective values. In order to specify the desired property from the Extended Data, you have to use the ExtendedPropertyName property of the ColorMeasureScale object.
For purposes of this example we will use world.shp ESRI shape file. The extended data for the shapes from this file contains “SQKM” property which represents area of the country in square kilometers. Here is an example, in which the MapShapeData objects get colored depending on the value of the country area.
<telerik:RadMap x:Name="radMap" ZoomLevel="1">
    <telerik:RadMap.Provider>
        <telerik:EmptyProvider />
    </telerik:RadMap.Provider>
    <telerik:VisualizationLayer Name="visualizationLayer">
        <telerik:VisualizationLayer.Colorizer>
            <telerik:ColorMeasureScale ExtendedPropertyName="SQKM" />
        </telerik:VisualizationLayer.Colorizer>
        <telerik:VisualizationLayer.Reader>
            <telerik:AsyncShapeFileReader DataSource="/TestMapFeatures;component/Resources/GeoData/world.dbf" Source="/TestMapFeatures;component/Resources/GeoData/world.shp" />
        </telerik:VisualizationLayer.Reader>
    </telerik:VisualizationLayer>
</telerik:RadMap>
The property specified through the ExtendedPropertyName should be of type Double.
Mode
The ColorMeasureScale splits the values passed through its ExtendedPropertyName property and associates a fill color and highlight color for each one. It can automatically create ranges in two ways. For that purpose you have to use the Mode property of the ColorMeasureScale object. It can have the following values:
Count - specifies that the data will get split into N equally sized ranges. The N is equal to the value of the TickMarkCount property of the ColorMeasureScale.
Step - specifies that the data will get split in ranges with step between them equal to X. The X is equal to the value of the TickMarkStep property of the ColorMeasureScale object.
Ranges - specifies that the filling of the ranges will be calculated automatically by the ColorMeasureScale colorizer.
RangesPredefinedColors - specifies that the ColorMeasureScale colorizer will use filling settings which are set in the MapRange definition.
Auto
When using the VisualizationLayer object together with one of the asynchronous shape readers (AsyncShapeFileReader, for example), the reader automatically force changing of the ColorMeasureScale properties. In this case you have to only use the Mode and one of the two additional properties. When you are using manually generated shapes, you have to create the ranges manually. To learn more read the Ranges section.
Here is an example of a ColorMeasureScale with 7 ranges:
<telerik:RadMap x:Name="radMap" ZoomLevel="1">
    <telerik:RadMap.Provider>
        <telerik:EmptyProvider />
    </telerik:RadMap.Provider>
    <telerik:VisualizationLayer Name="visualizationLayer">
        <telerik:VisualizationLayer.Colorizer>
            <telerik:ColorMeasureScale ExtendedPropertyName="SQKM"
                                       Mode="Count"
                                       TickMarkCount="7" />
        </telerik:VisualizationLayer.Colorizer>
        <telerik:VisualizationLayer.Reader>
            <telerik:AsyncShapeFileReader DataSource="/TestMapFeatures;component/Resources/GeoData/world.dbf" Source="/TestMapFeatures;component/Resources/GeoData/world.shp" />
        </telerik:VisualizationLayer.Reader>
    </telerik:VisualizationLayer>
</telerik:RadMap>
The following example shows how to use the ColorMeasureScale with Ranges mode:
<telerik:VisualizationLayer.Colorizer>
    <telerik:ColorMeasureScale ExtendedPropertyName="SQKM" Mode="Ranges">
        <telerik:ColorMeasureScale.RangeCollection>
            <telerik:MapRange MaxValue="2416216" MinValue="0" />
            <telerik:MapRange MaxValue="4832060" MinValue="2416216" />
            <telerik:MapRange MaxValue="7247904" MinValue="4832060" />
            <telerik:MapRange MaxValue="9663749" MinValue="7247904" />
            <telerik:MapRange MaxValue="12079593" MinValue="9663749" />
            <telerik:MapRange MaxValue="14495437" MinValue="12079593" />
            <telerik:MapRange MaxValue="16911282" MinValue="14495437" />
        </telerik:ColorMeasureScale.RangeCollection>
    </telerik:ColorMeasureScale>
</telerik:VisualizationLayer.Colorizer>
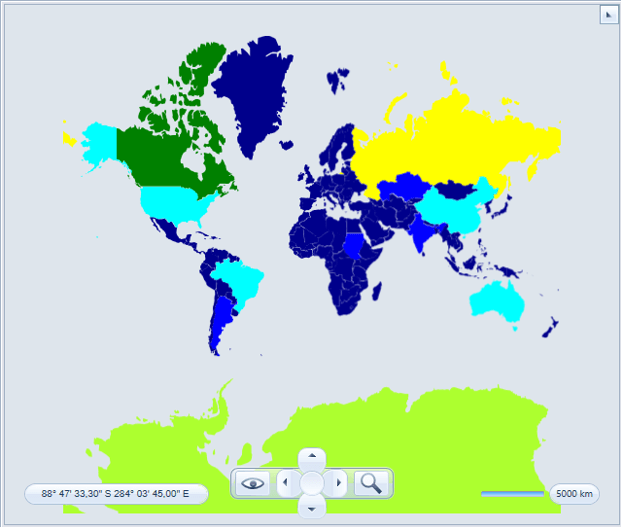
And the following demonstrates the ColorMeasureScale with RangesPredefinedColors mode:
<telerik:VisualizationLayer.Colorizer>
    <telerik:ColorMeasureScale ExtendedPropertyName="SQKM" Mode="RangesPredefinedColors">
        <telerik:ColorMeasureScale.RangeCollection>
            <telerik:MapRange MaxValue="2416216" MinValue="0">
                <telerik:MapRange.ShapeFill>
                    <telerik:MapShapeFill Fill="DarkBlue" />
                </telerik:MapRange.ShapeFill>
            </telerik:MapRange>
            <telerik:MapRange MaxValue="4832060" MinValue="2416216">
                <telerik:MapRange.ShapeFill>
                    <telerik:MapShapeFill Fill="Blue" />
                </telerik:MapRange.ShapeFill>
            </telerik:MapRange>
            <telerik:MapRange MaxValue="7247904" MinValue="4832060">
                <telerik:MapRange.ShapeFill>
                    <telerik:MapShapeFill Fill="SkyBlue" />
                </telerik:MapRange.ShapeFill>
            </telerik:MapRange>
            <telerik:MapRange MaxValue="9663749" MinValue="7247904">
                <telerik:MapRange.ShapeFill>
                    <telerik:MapShapeFill Fill="Aqua" />
                </telerik:MapRange.ShapeFill>
            </telerik:MapRange>
            <telerik:MapRange MaxValue="12079593" MinValue="9663749">
                <telerik:MapRange.ShapeFill>
                    <telerik:MapShapeFill Fill="Green" />
                </telerik:MapRange.ShapeFill>
            </telerik:MapRange>
            <telerik:MapRange MaxValue="14495437" MinValue="12079593">
                <telerik:MapRange.ShapeFill>
                    <telerik:MapShapeFill Fill="GreenYellow" />
                </telerik:MapRange.ShapeFill>
            </telerik:MapRange>
            <telerik:MapRange MaxValue="16911282" MinValue="14495437">
                <telerik:MapRange.ShapeFill>
                    <telerik:MapShapeFill Fill="Yellow" />
                </telerik:MapRange.ShapeFill>
            </telerik:MapRange>
        </telerik:ColorMeasureScale.RangeCollection>
    </telerik:ColorMeasureScale>
</telerik:VisualizationLayer.Colorizer>
In the snapshots below you can see how the above example will be displayed
Colors
The ColorMeasureScale can apply a different color to each range it creates. You are able to specify the desired set of colors not only for the normal fill of the shapes, but for the highlighted one too. This is done by using the ShapeFillCollection and HighlightFillCollection properties. They are collections of MapShapeFill objects.
If you are creating the ranges manually, you can pass the MapShapeFill object directly to the MapRange object. To learn more read the Ranges section.
The first color will get applied to the lowest layer.
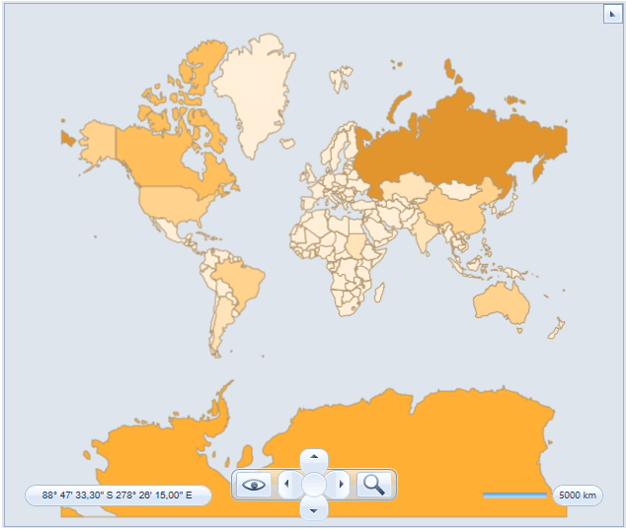
In case you have more ranges than colors the specified colors will be used as gradient stops along the scale to create filling for all ranges. For example if you want to have the same highlight color for all of the ranges, you just define one entry in the HighlightFillCollection property.
<telerik:RadMap x:Name="radMap" ZoomLevel="1">
    <telerik:RadMap.Provider>
        <telerik:EmptyProvider />
    </telerik:RadMap.Provider>
    <telerik:VisualizationLayer Name="visualizationLayer">
        <telerik:VisualizationLayer.Colorizer>
            <telerik:ColorMeasureScale ExtendedPropertyName="SQKM"
                                       Mode="Count"
                                       TickMarkCount="10">
                <telerik:ColorMeasureScale.ShapeFillCollection>
                    <telerik:MapShapeFill Fill="#FFF0D9"
                                          Stroke="#B1946D"
                                          StrokeThickness="1" />
                    <telerik:MapShapeFill Fill="#FFE4BA"
                                          Stroke="#B1946D"
                                          StrokeThickness="1" />
                    <telerik:MapShapeFill Fill="#FFDBA3"
                                          Stroke="#B1946D"
                                          StrokeThickness="1" />
                    <telerik:MapShapeFill Fill="#FFD28D"
                                          Stroke="#B1946D"
                                          StrokeThickness="1" />
                    <telerik:MapShapeFill Fill="#FFBF5C"
                                          Stroke="#B1946D"
                                          StrokeThickness="1" />
                    <telerik:MapShapeFill Fill="#FFAF33"
                                          Stroke="#B1946D"
                                          StrokeThickness="1" />
                    <telerik:MapShapeFill Fill="#E2942D"
                                          Stroke="#B1946D"
                                          StrokeThickness="1" />
                </telerik:ColorMeasureScale.ShapeFillCollection>
                <telerik:ColorMeasureScale.HighlightFillCollection>
                    <telerik:MapShapeFill Fill="Orange"
                                          Stroke="#B1946D"
                                          StrokeThickness="1" />
                </telerik:ColorMeasureScale.HighlightFillCollection>
            </telerik:ColorMeasureScale>
        </telerik:VisualizationLayer.Colorizer>
        <telerik:VisualizationLayer.Reader>
            <telerik:AsyncShapeFileReader DataSource="/TestMapFeatures;component/Resources/GeoData/world.dbf" Source="/TestMapFeatures;component/Resources/GeoData/world.shp" />
        </telerik:VisualizationLayer.Reader>
    </telerik:VisualizationLayer>
</telerik:RadMap>
With the approach shown above any 2 shapes (even if they are neighbors) may be colored equally. To avoid this you should use the Graph Colorizer.
Ranges
The ranges for the ColorMeasureScale can be defined in several different ways. The first one is by only using the Mode and the TickMarkCount or TickMarkStep property. This approach is applicable when using the VisualizationLayer object together with one of the asynchronous shape readers (AsyncShapeFileReader, for example). Here is an example:
<telerik:RadMap x:Name="radMap" ZoomLevel="1">
    <telerik:RadMap.Provider>
        <telerik:EmptyProvider />
    </telerik:RadMap.Provider>
    <telerik:VisualizationLayer Name="visualizationLayer">
        <telerik:VisualizationLayer.Colorizer>
            <telerik:ColorMeasureScale ExtendedPropertyName="SQKM"
                                       Mode="Count"
                                       TickMarkCount="7">
                <telerik:ColorMeasureScale.ShapeFillCollection>
                    <telerik:MapShapeFill Fill="#FFF0D9"
                                          Stroke="#B1946D"
                                          StrokeThickness="1" />
                    <telerik:MapShapeFill Fill="#FFE4BA"
                                          Stroke="#B1946D"
                                          StrokeThickness="1" />
                    <telerik:MapShapeFill Fill="#FFDBA3"
                                          Stroke="#B1946D"
                                          StrokeThickness="1" />
                    <telerik:MapShapeFill Fill="#FFD28D"
                                          Stroke="#B1946D"
                                          StrokeThickness="1" />
                    <telerik:MapShapeFill Fill="#FFBF5C"
                                          Stroke="#B1946D"
                                          StrokeThickness="1" />
                    <telerik:MapShapeFill Fill="#FFAF33"
                                          Stroke="#B1946D"
                                          StrokeThickness="1" />
                    <telerik:MapShapeFill Fill="#E2942D"
                                          Stroke="#B1946D"
                                          StrokeThickness="1" />
                </telerik:ColorMeasureScale.ShapeFillCollection>
                <telerik:ColorMeasureScale.HighlightFillCollection>
                    <telerik:MapShapeFill Fill="Orange"
                                          Stroke="#B1946D"
                                          StrokeThickness="1" />
                </telerik:ColorMeasureScale.HighlightFillCollection>
            </telerik:ColorMeasureScale>
        </telerik:VisualizationLayer.Colorizer>
        <telerik:VisualizationLayer.Reader>
            <telerik:AsyncShapeFileReader DataSource="/TestMapFeatures;component/Resources/GeoData/world.dbf" Source="/TestMapFeatures;component/Resources/GeoData/world.shp" />
        </telerik:VisualizationLayer.Reader>
    </telerik:VisualizationLayer>
</telerik:RadMap>
Another approach is to manually define the Min and Max values of the ColorMeasureScale object and to use the Mode property together with the TickMarkCount or TickMarkStep property. This approach is useful, when having VisualizationLayer that displays manually generated shapes.
<telerik:RadMap x:Name="radMap" ZoomLevel="1">
    <telerik:RadMap.Provider>
        <telerik:EmptyProvider />
    </telerik:RadMap.Provider>
    <telerik:VisualizationLayer Name="visualizationLayer">
        <telerik:VisualizationLayer.Colorizer>
            <telerik:ColorMeasureScale ExtendedPropertyName="SQKM"
                                       MaxValue="17000000"
                                       MinValue="0"
                                       Mode="Count"
                                       TickMarkCount="10">
                <telerik:ColorMeasureScale.ShapeFillCollection>
                    <telerik:MapShapeFill Fill="#FFF0D9"
                                          Stroke="#B1946D"
                                          StrokeThickness="1" />
                    <telerik:MapShapeFill Fill="#FFE4BA"
                                          Stroke="#B1946D"
                                          StrokeThickness="1" />
                    <telerik:MapShapeFill Fill="#FFDBA3"
                                          Stroke="#B1946D"
                                          StrokeThickness="1" />
                    <telerik:MapShapeFill Fill="#FFD28D"
                                          Stroke="#B1946D"
                                          StrokeThickness="1" />
                    <telerik:MapShapeFill Fill="#FFBF5C"
                                          Stroke="#B1946D"
                                          StrokeThickness="1" />
                    <telerik:MapShapeFill Fill="#FFAF33"
                                          Stroke="#B1946D"
                                          StrokeThickness="1" />
                    <telerik:MapShapeFill Fill="#E2942D"
                                          Stroke="#B1946D"
                                          StrokeThickness="1" />
                </telerik:ColorMeasureScale.ShapeFillCollection>
                <telerik:ColorMeasureScale.HighlightFillCollection>
                    <telerik:MapShapeFill Fill="Orange"
                                          Stroke="#B1946D"
                                          StrokeThickness="1" />
                </telerik:ColorMeasureScale.HighlightFillCollection>
            </telerik:ColorMeasureScale>
        </telerik:VisualizationLayer.Colorizer>
    </telerik:VisualizationLayer>
</telerik:RadMap>
Additionally with the Min and Max values defined you can directly define the desired ranges at design-time via the RangeCollection property of the ColorMeasureScale object. In this case you can either use the HighlightFillCollection and ShapeFillCollection properties, or specify the desired colors via the HighlightFill and ShapeFill properties of the MapRange object. Here is an example.
<telerik:VisualizationLayer.Colorizer>
    <telerik:ColorMeasureScale ExtendedPropertyName="SQKM" Mode="RangesPredefinedColors">
        <telerik:ColorMeasureScale.RangeCollection>
            <telerik:MapRange MaxValue="2416216" MinValue="0">
                <telerik:MapRange.ShapeFill>
                    <telerik:MapShapeFill Fill="DarkBlue" />
                </telerik:MapRange.ShapeFill>
            </telerik:MapRange>
            <telerik:MapRange MaxValue="4832060" MinValue="2416216">
                <telerik:MapRange.ShapeFill>
                    <telerik:MapShapeFill Fill="Blue" />
                </telerik:MapRange.ShapeFill>
            </telerik:MapRange>
            <telerik:MapRange MaxValue="7247904" MinValue="4832060">
                <telerik:MapRange.ShapeFill>
                    <telerik:MapShapeFill Fill="SkyBlue" />
                </telerik:MapRange.ShapeFill>
            </telerik:MapRange>
            <telerik:MapRange MaxValue="9663749" MinValue="7247904">
                <telerik:MapRange.ShapeFill>
                    <telerik:MapShapeFill Fill="Aqua" />
                </telerik:MapRange.ShapeFill>
            </telerik:MapRange>
            <telerik:MapRange MaxValue="12079593" MinValue="9663749">
                <telerik:MapRange.ShapeFill>
                    <telerik:MapShapeFill Fill="Green" />
                </telerik:MapRange.ShapeFill>
            </telerik:MapRange>
            <telerik:MapRange MaxValue="14495437" MinValue="12079593">
                <telerik:MapRange.ShapeFill>
                    <telerik:MapShapeFill Fill="GreenYellow" />
                </telerik:MapRange.ShapeFill>
            </telerik:MapRange>
            <telerik:MapRange MaxValue="16911282" MinValue="14495437">
                <telerik:MapRange.ShapeFill>
                    <telerik:MapShapeFill Fill="Yellow" />
                </telerik:MapRange.ShapeFill>
            </telerik:MapRange>
        </telerik:ColorMeasureScale.RangeCollection>
    </telerik:ColorMeasureScale>
</telerik:VisualizationLayer.Colorizer>