RadarLineSeries
This series is visualized on the screen as a straight line connecting each of the DataPoints.
Declaratively defined series
You can use the following definition to display a simple RadarLineSeries
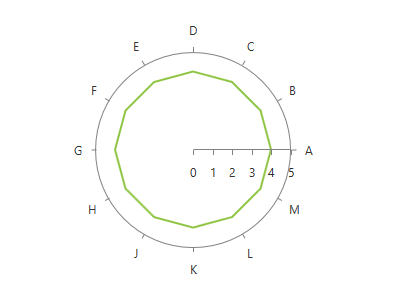
Example 1: Declaring an RadarLineSeries in XAML
<telerik:RadPolarChart Palette="Windows8">
    <telerik:RadPolarChart.PolarAxis>
        <telerik:PolarAxis />
    </telerik:RadPolarChart.PolarAxis>
    <telerik:RadPolarChart.RadialAxis>
        <telerik:CategoricalRadialAxis />
    </telerik:RadPolarChart.RadialAxis>
    <telerik:RadPolarChart.Series>
        <telerik:RadarLineSeries>
            <telerik:RadarLineSeries.DataPoints>
                <telerik:CategoricalDataPoint Category="A" Value="4" />
                <telerik:CategoricalDataPoint Category="B" Value="4" />
                <telerik:CategoricalDataPoint Category="C" Value="4" />
                <telerik:CategoricalDataPoint Category="D" Value="4" />
                <telerik:CategoricalDataPoint Category="E" Value="4" />
                <telerik:CategoricalDataPoint Category="F" Value="4" />
                <telerik:CategoricalDataPoint Category="G" Value="4" />
                <telerik:CategoricalDataPoint Category="H" Value="4" />
                <telerik:CategoricalDataPoint Category="J" Value="4" />
                <telerik:CategoricalDataPoint Category="K" Value="4" />
                <telerik:CategoricalDataPoint Category="L" Value="4" />
                <telerik:CategoricalDataPoint Category="M" Value="4" />
            </telerik:RadarLineSeries.DataPoints>
        </telerik:RadarLineSeries>
    </telerik:RadPolarChart.Series>
</telerik:RadPolarChart>
Properties
- CategoryBinding: A property of type DataPointBinding that gets or sets the property path that determines the category value of the data point.
- ValueBinding: A property of type DataPointBinding that gets or sets the property path that determines the value of the data point.
- PointSize: A property of type Size that get or sets the size of the points. This property will be ignored if PointTemplate property is set.
- IsClosed: A bolean property that gets or sets a value indicating whether the line curve will be closed. In other words, last point will be connected to the first one. The default value is True.
Data Binding
You can use the ValueBinding and CategoryBinding properties of the PointSeries to bind the DataPoints’ properties to the properties from your view models.
Example 2: Defining the view model
public class PlotInfo
{
    public string Category { get; set; }
    public double Value { get; set; }
}

//.......
this.DataContext = new ObservableCollection<PlotInfo>
{
    new PlotInfo() { Category = "January", Value = 2},
    //....
};
Example 3: Specify a PointSeries in XAML
<telerik:RadPolarChart.Series>
    <telerik:RadarLineSeries ItemsSource="{Binding Data}" ValueBinding="Value" CategoryBinding="Category"/>
</telerik:RadPolarChart.Series>
See the Create Data-Bound Chart for more information on data binding in the RadChartView suite.