ErrorBarSeries
This type of series visualizes its data points using error bar shapes.
The error bar shape allows you to display a error or uncertainty in the plotted data. The shape consists of a single line with caps at the two ends. An additional marker that shows the expected measure can be displayed too.
To start using the series, add it in the Series collection of the chart and populate its DataPoints collection (or the ItemsSource).
Defining ErrorBarSeries in XAML
<telerik:RadCartesianChart>
    <telerik:RadCartesianChart.VerticalAxis>
        <telerik:LinearAxis />
    </telerik:RadCartesianChart.VerticalAxis>
    <telerik:RadCartesianChart.HorizontalAxis>
        <telerik:CategoricalAxis/>
    </telerik:RadCartesianChart.HorizontalAxis>
    <telerik:RadCartesianChart.Series>
        <telerik:ErrorBarSeries>
            <telerik:ErrorBarSeries.DataPoints>
                <telerik:ErrorBarDataPoint Category="A" Low="15" High="80" />
                <telerik:ErrorBarDataPoint Category="B" Low="10" High="60" />
                <telerik:ErrorBarDataPoint Category="C" Low="25" High="75" />
                <telerik:ErrorBarDataPoint Category="D" Low="15" High="80" />
                <telerik:ErrorBarDataPoint Category="E" Low="10" High="60" />
            </telerik:ErrorBarSeries.DataPoints>
        </telerik:ErrorBarSeries>
    </telerik:RadCartesianChart.Series>
</telerik:RadCartesianChart>
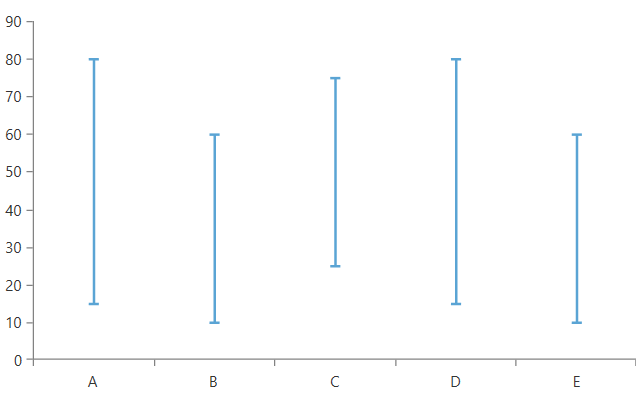
The error bar data points do not implement automatic coercion of the input values. This means that the provided values must be correct in order to display a proper visual element. Low must be smaller than High and the Value must be between low and high.
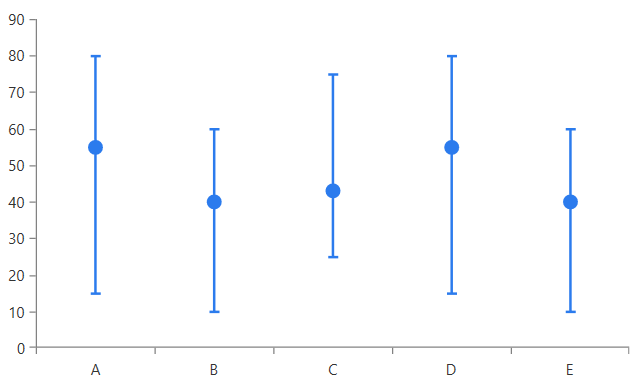
Showing Value Marker
The series allows you to display an additional marker that shows the expected measure of the data point. To enable this, set the ShowMarker property of the ErrorBarShape element and the Value property of the ErrorBarDataPoint (or ValueBinding when using the ItemsSource.
Showing ErrorBarSeries markers
<telerik:RadCartesianChart>
    <telerik:RadCartesianChart.VerticalAxis>
        <telerik:LinearAxis />
    </telerik:RadCartesianChart.VerticalAxis>
    <telerik:RadCartesianChart.HorizontalAxis>
        <telerik:CategoricalAxis/>
    </telerik:RadCartesianChart.HorizontalAxis>
    <telerik:RadCartesianChart.Series>
        <telerik:ErrorBarSeries>
            <telerik:ErrorBarSeries.DataPoints>
                <telerik:ErrorBarDataPoint Category="A" Low="15" High="80" Value="55"/>
                <telerik:ErrorBarDataPoint Category="B" Low="10" High="60" Value="40"/>
                <telerik:ErrorBarDataPoint Category="C" Low="25" High="75" Value="43"/>
                <telerik:ErrorBarDataPoint Category="D" Low="15" High="80" Value="55"/>
                <telerik:ErrorBarDataPoint Category="E" Low="10" High="60" Value="40"/>
            </telerik:ErrorBarSeries.DataPoints>
            <telerik:ErrorBarSeries.DefaultVisualStyle>
                <Style TargetType="telerik:ErrorBarShape">
                    <Setter Property="Stroke" Value="#2B7BED" />
                    <Setter Property="Fill" Value="#2B7BED" />
                    <Setter Property="StrokeThickness" Value="2" />
                    <Setter Property="ShowMarker" Value="True"/>
                </Style>
            </telerik:ErrorBarSeries.DefaultVisualStyle>
        </telerik:ErrorBarSeries>
    </telerik:RadCartesianChart.Series>
</telerik:RadCartesianChart>
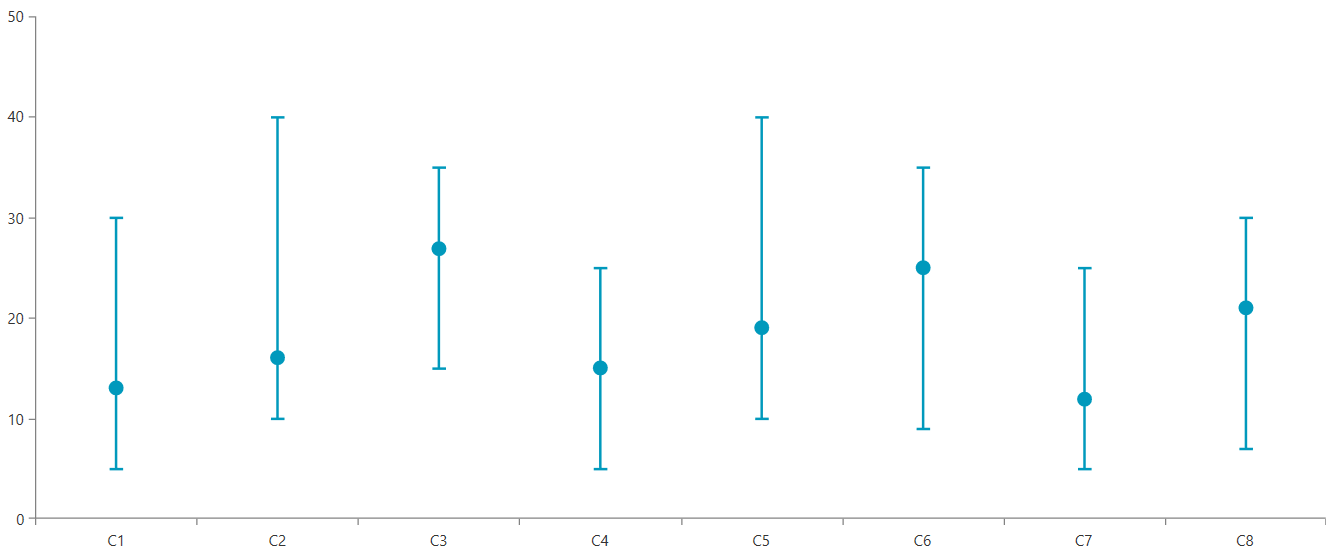
Data Binding
The ErrorBarSeries works with data point objects of type ErrorBarDataPoint. In a data binding scenario a ErrorBarDataPoint will be created for each data item in the ItemsSource collection of the series. To map the properties of the business objects from the ItemsSource to the properties of the data point object, use the binding properties of the series:
- CategoryBinding
- LowBinding
- HighBinding
- ValueBinding
The following example shows how to create a simple object describing the error bar and populate the series with a sample collection.
Defining the model
public class ErrorBarInfo
{
    public string Category { get; set; }
    public double Low { get; set; }
    public double High { get; set; }
    public double Value { get; set; }
}
Populating the data
public MyUserControl()
{
    InitializeComponent();

    var source = new ObservableCollection<ErrorBarInfo>()
    {
        new ErrorBarInfo() { Category = "C1", Low = 5, High = 30, Value = 13 },
        new ErrorBarInfo() { Category = "C2", Low = 10, High = 40, Value = 16 },
        new ErrorBarInfo() { Category = "C3", Low = 15, High = 35, Value = 27 },
        new ErrorBarInfo() { Category = "C4", Low = 5, High = 25, Value = 15 },
        new ErrorBarInfo() { Category = "C5", Low = 10, High = 40, Value = 19 },
        new ErrorBarInfo() { Category = "C6", Low = 9, High = 35, Value = 25 },
        new ErrorBarInfo() { Category = "C7", Low = 5, High = 25, Value = 12 },
        new ErrorBarInfo() { Category = "C8", Low = 7, High = 30, Value = 21 },
    };
    this.errorBarSeries.ItemsSource = source;
}
Defining ErrorBarSeries in data binding scenario
<telerik:RadCartesianChart Palette="Fluent">
    <telerik:RadCartesianChart.VerticalAxis>
        <telerik:LinearAxis />
    </telerik:RadCartesianChart.VerticalAxis>
    <telerik:RadCartesianChart.HorizontalAxis>
        <telerik:CategoricalAxis/>
    </telerik:RadCartesianChart.HorizontalAxis>
    <telerik:RadCartesianChart.Series>
        <telerik:ErrorBarSeries x:Name="errorBarSeries"
                                CategoryBinding="Category"
                                LowBinding="Low"
                                HighBinding="High"
                                ValueBinding="Value">
            <telerik:ErrorBarSeries.DefaultVisualStyle>
                <Style TargetType="telerik:ErrorBarShape">
                    <Setter Property="StrokeThickness" Value="2" />
                    <Setter Property="ShowMarker" Value="True"/>
                </Style>
            </telerik:ErrorBarSeries.DefaultVisualStyle>
        </telerik:ErrorBarSeries>
    </telerik:RadCartesianChart.Series>
</telerik:RadCartesianChart>
Read more about the data binding support in the Create Data-Bound Chart article.
Customizing the Appearance
The appearance of the error bar visual can be modified using the DefaultVisualStyle property of the series. The style should target the ErrorBarShape element. Read more in the ErrorBar section of the Customizing CartesianChart Series help article.