TrixIndicator
TrixIndicator (triple exponential average) is used as a momentum indicator that oscillates around a zero line.
To set up the indicator you can set its CategoryBinding, ValueBinding and ItemsSource properties. Additionally, you can control the period (in days) over which the indicator will be applied. To do this set the Period property.
Example 1: TrixIndicator
 <telerik:RadCartesianChart.Indicators>
    <telerik:TrixIndicator Period="8"
                           CategoryBinding="Date"
                           ValueBinding="Close"
                           ItemsSource="{Binding Data}"/>
</telerik:RadCartesianChart.Indicators>
Figure 1: TrixIndicator
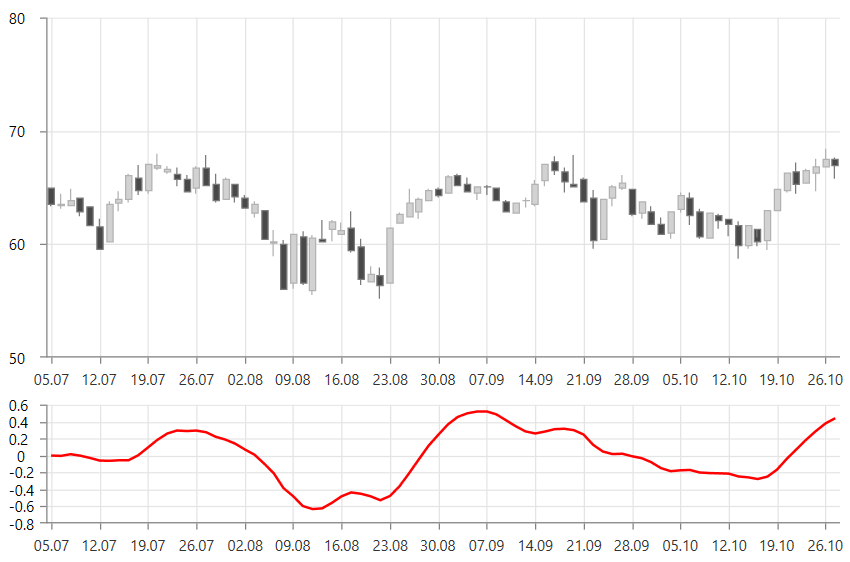
Figure 1 shows 2 instances of RadCartesianChart. The top one shows only the candlestick series that displays the original data. The chart on the bottom shows the indicator.
The indicator can be set up the same way as a normal chart series. This is why you can populate it using the same approach as shown in the Data Bind to Data-Object article. You can set the corresponding value binding properties - for example, ValueBinding, CategoryBinding, HighBinding, CloseBinding, etc, and also the ItemsSource.