Overview
Annotations are visual elements that can be used highlight certain areas on the plot area and denote statistical significance.
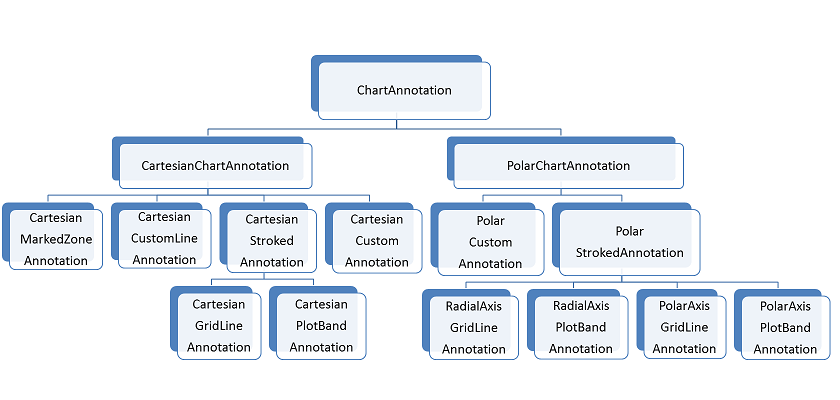
The ChartView provides the following types of annotations:
Cartesian GridLine
Cartesian PlotBand
Cartesian Custom
Cartesian MarkedZone
Cartesian CustomLine
Polar Axis GridLine (associated with the polar axis)
Polar Axis PlotBand (associated with the polar axis)
Radial Axis GridLine (associated with the radial axis)
Radial Axis PlotBand (associated with the radial axis)
Polar Custom