Logarithmic Axis
In a logarithmic axis the value of each consecutive tick is X times higher than the previous value. You can control how much higher each value is with the LogarithmBase property. Another important property that the logarithmic axis exposes in addition to the common properties for all axes is the ExponentStep. The default value for the ExponentStep is 1 and the default value for the LogarithmBase is 10.
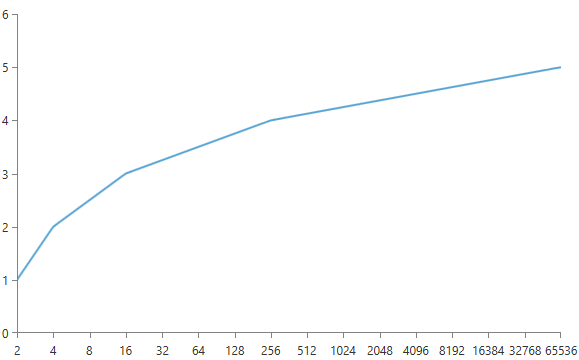
Example 1: Setting the LogarithmBase property
<telerik:RadCartesianChart x:Name="chart">
    <telerik:RadCartesianChart.HorizontalAxis>
        <telerik:LogarithmicAxis LogarithmBase="2" />
    </telerik:RadCartesianChart.HorizontalAxis>

    <telerik:RadCartesianChart.VerticalAxis>
        <telerik:LinearAxis/>
    </telerik:RadCartesianChart.VerticalAxis>

    <telerik:ScatterLineSeries>
        <telerik:ScatterLineSeries.DataPoints>
            <telerik:ScatterDataPoint XValue="2"
                                        YValue="1"/>
            <telerik:ScatterDataPoint XValue="4"
                                        YValue="2"/>
            <telerik:ScatterDataPoint XValue="16"
                                        YValue="3"/>
            <telerik:ScatterDataPoint XValue="256"
                                        YValue="4"/>
            <telerik:ScatterDataPoint XValue="65536"
                                        YValue="5"/>
        </telerik:ScatterLineSeries.DataPoints>
    </telerik:ScatterLineSeries>
</telerik:RadCartesianChart>
Figure 1: Result from Example 1
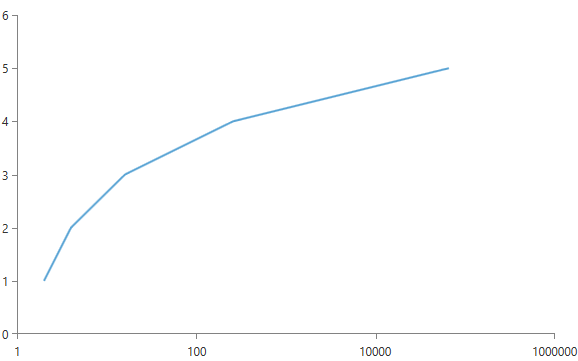
Example 2: Setting the ExponentStep property
<telerik:RadCartesianChart x:Name="chart">
    <telerik:RadCartesianChart.HorizontalAxis>
        <telerik:LogarithmicAxis ExponentStep="2" />
    </telerik:RadCartesianChart.HorizontalAxis>

    <telerik:RadCartesianChart.VerticalAxis>
        <telerik:LinearAxis/>
    </telerik:RadCartesianChart.VerticalAxis>

    <telerik:ScatterLineSeries>
        <telerik:ScatterLineSeries.DataPoints>
            <telerik:ScatterDataPoint XValue="2"
                                        YValue="1"/>
            <telerik:ScatterDataPoint XValue="4"
                                        YValue="2"/>
            <telerik:ScatterDataPoint XValue="16"
                                        YValue="3"/>
            <telerik:ScatterDataPoint XValue="256"
                                        YValue="4"/>
            <telerik:ScatterDataPoint XValue="65536"
                                        YValue="5"/>
        </telerik:ScatterLineSeries.DataPoints>
    </telerik:ScatterLineSeries>
</telerik:RadCartesianChart>
Figure 2: Result from Example 2