Date Time Axes
RadChartView has two DateTime dedicated axes. The first one is DateTimeCategoricalAxis, the other is DateTimeContinuousAxis. These axes are different in nature as one is categorical (discrete), and the other is continuous. This topic will cover the specific properties of these two axes.
Date Time Continuous Axis
The DateTimeContinuousAxis is like a numerical axis but the axis value range consists of DateTime values which are always sorted chronologically. This axis expects each data point to provide a System.DateTime structure as its value for this axis. It does not work with categories, it works with ranges. The base unit (or the timeline step) of the axis is calculated depending on the smallest difference between any two dates.
Specific Properties
-
ActualRange: A property of type ValueRange
that gets the actual range used by the axis to plot data points. -
ActualVisibleRange: A property of type ValueRange
that gets the range that is actually visible on the plot area when the chart is zoomed in. - GapLength: A property of type double that gets or sets the gap (in the range [0, 1]) to be applied when calculating each plotted Telerik.Windows.Controls.ChartView.ChartSeries position. More information regarding this property can be found in the Gap Length help article.
- MajorStep: A property of type double that gets or sets the user-defined step between two adjacent ticks on the axis. Specify TimeSpan.Zero to clear the value. If not specified, the step will be automatically determined, depending on the smallest difference between any two dates.
- MajorStepUnit: A property of type TimeInterval that gets or sets the unit that defines the custom major step of the axis. If no explicit step is defined, the axis will automatically calculate one, depending on the smallest difference between any two dates.
- Maximum: A property of type DateTime that gets or sets the maximum date of the axis
- MaximumTicks: An Integer property that gets or sets the maximum ticks that might be displayed on the axis.
- Minimum: A property of type DateTime that gets or sets the minimum date of the axis.
- PlotMode: A property of type AxisPlotMode that gets or sets the mode which determines how points are plotted by this axis. The plot mode is an enumeration and it allows the following values: BetweenTicks, OnTicks, and OnTicksPadded.
- TickOrigin: A nullable property of type DateTime that gets or sets from which point the ticks will start drawing. The position of the ticks is determined based on the combination of the MajorStep and TickOrigin values.
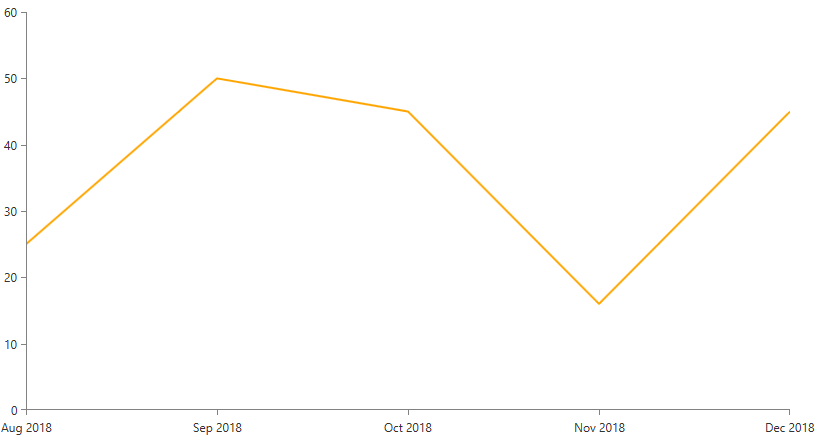
Here is an example XAML snippet that demonstrates how to create chart with horizontal date time continuous axis:
Example 1: Setting DateTimeContinuousAxis
<telerik:RadCartesianChart x:Name="chart">
   <telerik:RadCartesianChart.HorizontalAxis>
      <telerik:DateTimeContinuousAxis LabelFitMode="MultiLine" LabelFormat="MMM yyyy"/>
   </telerik:RadCartesianChart.HorizontalAxis>

   <telerik:RadCartesianChart.VerticalAxis>
      <telerik:LinearAxis/>
   </telerik:RadCartesianChart.VerticalAxis>

   <telerik:RadCartesianChart.Series>
      <telerik:LineSeries Stroke="Orange"
                        StrokeThickness="2"/>
   </telerik:RadCartesianChart.Series>
</telerik:RadCartesianChart>
Below is the binding logic:
Example 2: Setting the binding in code behind
public MainPage()
{
    InitializeComponent();
    DateTime lastDate = DateTime.Now;
    double[] lastVal = new double[] { 25,50,45,16,45 };

    List<ChartDataObject> dataSouce = new List<ChartDataObject>();
    for (int i = 0; i < 5; ++i)
    {
        ChartDataObject obj = new ChartDataObject { Date = lastDate.AddMonths(1), Value = lastVal[i] };
        dataSouce.Add(obj);
        lastDate = obj.Date;
    }
    LineSeries series = (LineSeries)this.chart.Series[0];
    series.CategoryBinding = new PropertyNameDataPointBinding() { PropertyName = "Date" };
    series.ValueBinding = new PropertyNameDataPointBinding() { PropertyName = "Value" };

    series.ItemsSource = dataSouce;
}
Public Sub New()
   InitializeComponent()

   Dim lastDate As DateTime = DateTime.Now
   Dim lastVal As Double() = New Double() {25, 50, 45, 16, 45}

   Dim dataSource As List(Of ChartDataObject) = New List(Of ChartDataObject)
   For i As Integer = 0 To 5 Step 1
      Dim obj As ChartDataObject = New ChartDataObject
      obj.Date = lastDate.AddMonths(1)
      obj.Value = lastVal(i)

      lastVal += 1
      dataSouce.Add(obj)
      lastDate = obj.Date
   Next

   Dim series As LineSeries = DirectCast(Me.chart.Series(0), LineSeries)

   Dim categoryBinding As PropertyNameDataPointBinding = New PropertyNameDataPointBinding
   categoryBinding.PropertyName = "Date"

   Dim valueBinding As PropertyNameDataPointBinding = New PropertyNameDataPointBinding
   valueBinding.PropertyName = "Value"

   series.CategoryBinding = categoryBinding
   series.ValueBinding = valueBinding
   series.ItemsSource = dataSource
End Sub
And finally the definition of the ChartDataObject class:
Example 3: Creating the businesses object
public class ChartDataObject
{
    public DateTime Date
    {
        get;
        set;
    }
    public double Value
    {
        get;
        set;
    }
}
Public Class ChartDataObject
    Dim _date As Date
    Dim _value As Double

    Public Property Date As DateTime
        Get
            Return Me._date
        End Get
        Set(value As DateTime)
            Me._date = value
        End Set
    End Property

    Public Property Value() As Double
        Get
            Return Me._value
        End Get
        Set(value As Double)
            Me._value = value
        End Set
    End Property
End Class
Date Time Categorical Axis
The DateTime categorical axis is a categorical axis with Date-Time values which are sorted chronologically and is represented by the DateTimeCategoricalAxis class. It also allows definition of categories based on specific date time components. For example if such an axis displays a range of one year, the data points can be plotted in categories for each month. If the range is one month, the values may be categorized by day and so on.
Specific Properties
- DateTimeComponent: A property of type DateTimeComponent that gets or sets how data points will be grouped. The DateTime component property is an enumeration and it allows the following values: Ticks, Year, Quarter, Month, Week, Hour, Minute, Second, Millisecond, Date, TimeOfDay, Day, DayOfWeek, DayOfYear.
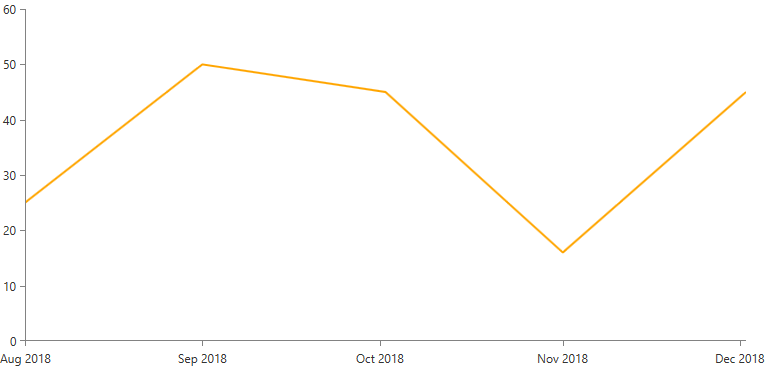
Example 4: Setting the DateTimeCategoricalAxis axes
<telerik:RadCartesianChart x:Name="chart">
   <telerik:RadCartesianChart.HorizontalAxis>
      <telerik:DateTimeCategoricalAxis LabelFitMode="MultiLine"
                                     LabelFormat="MMM yyyy"
                                     DateTimeComponent="Month"/>
   </telerik:RadCartesianChart.HorizontalAxis>

   <telerik:RadCartesianChart.VerticalAxis>
      <telerik:LinearAxis/>
   </telerik:RadCartesianChart.VerticalAxis>

   <telerik:RadCartesianChart.Series>
      <telerik:LineSeries Stroke="Orange"
                        StrokeThickness="2"/>

   </telerik:RadCartesianChart.Series>
</telerik:RadCartesianChart>