Multiple Datasources
SeriesMappingItemsSource feature is new* to* Q1 2011. It will be helpful for those who want to use declarative binding and is much more MVVM friendly. It also allows the RadChart's Series to have different number of datapoints.
The following example will demonstrate how to bind two Line Series - the first one with Manual Series Mapping and the second one with the new feature:
1 . Create new Business Object:
public class MyDateObject
{
    public double Value { get; set; }
    public double Value2 { get; set; }

    public MyDateObject(double value, double value2)
    {
        this.Value = value;
        this.Value2 = value2;
    }

    public static ObservableCollection<MyDateObject> GetData(int count)
    {
        Random r = new Random();
        ObservableCollection<MyDateObject> result = new ObservableCollection<MyDateObject>();

        for (int i = 0; i < count; i++)
        {
            result.Add(new MyDateObject(r.Next(0, 100), r.Next(0, 100)));
        }

        return result;
    }
}
Public Class MyDateObject
    Public Property Value() As Double
    Public Property Value2() As Double

    Public Sub New(ByVal value As Double, ByVal value2 As Double)
        Me.Value = value
        Me.Value2 = value2
    End Sub

    Public Shared Function GetData(ByVal count As Integer) As ObservableCollection(Of MyDateObject)
        Dim r As New Random()
        Dim result As New ObservableCollection(Of MyDateObject)()

        For i As Integer = 0 To count - 1
            result.Add(New MyDateObject(r.Next(0, 100), r.Next(0, 100)))
        Next i

        Return result
    End Function
End Class
2 . Create a new class named MyViewModel, which implements the ViewModelBase interface. It's property Data will be used as ItemsSource for the Chart (to bind the First Line using Manual Series Mapping approach) and the MappingData will be ItemsSource for the second Line.
public class MyViewModel : ViewModelBase
{
    private ObservableCollection<MyDateObject> _data;
    public ObservableCollection<MyDateObject> Data
    {
        get
        {
            return this._data;
        }
        set
        {
            if (this._data != value)
            {
                this._data = value;
                this.OnPropertyChanged("Data");
            }
        }
    }

    private ObservableCollection<MyDateObject> _mappingData;
    public ObservableCollection<MyDateObject> MappingData
    {
        get
        {
            return this._mappingData;
        }
        set
        {
            if (this._mappingData != value)
            {
                this._mappingData = value;
                this.OnPropertyChanged("MappingData");
            }
        }
    }

    public MyViewModel()
    {
        this.Data = MyDateObject.GetData(10);
        this.MappingData = MyDateObject.GetData(20);
    }
}
Public Class MyViewModel
    Inherits ViewModelBase
    Private _data As ObservableCollection(Of MyDateObject)
    Public Property Data() As ObservableCollection(Of MyDateObject)
        Get
            Return Me._data
        End Get
        Set(ByVal value As ObservableCollection(Of MyDateObject))
            If Me._data IsNot value Then
                Me._data = value
                Me.OnPropertyChanged("Data")
            End If
        End Set
    End Property

    Private _mappingData As ObservableCollection(Of MyDateObject)
    Public Property MappingData() As ObservableCollection(Of MyDateObject)
        Get
            Return Me._mappingData
        End Get
        Set(ByVal value As ObservableCollection(Of MyDateObject))
            If Me._mappingData IsNot value Then
                Me._mappingData = value
                Me.OnPropertyChanged("MappingData")
            End If
        End Set
    End Property

    Public Sub New()
        Me.Data = MyDateObject.GetData(10)
        Me.MappingData = MyDateObject.GetData(20)
    End Sub
End Class
3 . Add new RadChart declaration.
<telerik:RadChart x:Name="RadChart1" ItemsSource="{Binding Data}" UseDefaultLayout="False">
            <telerik:ChartArea x:Name="ChartArea1" EnableAnimations="False"/>
            <telerik:RadChart.SeriesMappings>
                <telerik:SeriesMapping ChartAreaName="ChartArea1" >
                    <telerik:SeriesMapping.SeriesDefinition>
                        <telerik:LineSeriesDefinition />
                    </telerik:SeriesMapping.SeriesDefinition>
                    <telerik:ItemMapping FieldName="Value" DataPointMember="YValue"/>
                </telerik:SeriesMapping>
                <telerik:SeriesMapping ChartAreaName="ChartArea1" ItemsSource="{Binding MappingData}" >
                    <telerik:SeriesMapping.SeriesDefinition>
                        <telerik:LineSeriesDefinition/>
                    </telerik:SeriesMapping.SeriesDefinition>
                    <telerik:ItemMapping FieldName="Value2" DataPointMember="YValue"/>
                </telerik:SeriesMapping>
            </telerik:RadChart.SeriesMappings>
        </telerik:RadChart>
The key here is to disable the Default Layout of the RadChart and manually set the two SeriesMappings in common ChartArea - done with providing same name to the Chart Area with "ChartAreaName" property. Otherwise the "No Data Series" default message will appear over the two Line Series.
4 . The final result should look like the snapshot below:
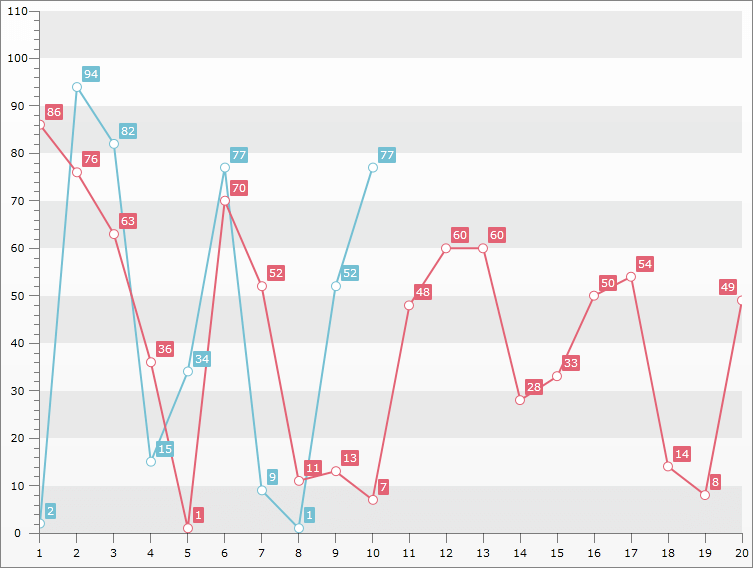
Another example is available here.