Drill Down Chart
To learn how to use the built-in RadChart Drill Down feature please read the Drill Down section.
The purpose of this tutorial is to show you the drill down capabilities of the chart with tooltips enabled.
The idea behind the drill down behavior is to move the chart content from summary information to detailed data by focusing on something.
This tutorial will use the Northwind database, which can be downloaded from here.
Also in the following examples the charts will be populated with a various data from an ADO.NET Data Service. You can read more information about populating with data here.
- Here is the initial RadChart declaration.
<FrameworkElement.Resources>
    <example:NorthwindDataSource x:Key="DataSource" />
</FrameworkElement.Resources>

<Grid x:Name="LayoutRoot" Background="White">
    <telerik:RadChart x:Name="radChart"
                      Margin="8"
                      ItemsSource="{Binding Source={StaticResource DataSource},
                                            Path=Products}">

        <telerik:RadChart.SeriesMappings>
            <telerik:SeriesMapping LegendLabel="Products UnitPrice">
                <telerik:SeriesMapping.SeriesDefinition>
                    <telerik:BarSeriesDefinition />
                </telerik:SeriesMapping.SeriesDefinition>
                <telerik:SeriesMapping.ItemMappings>

                    <telerik:ItemMapping DataPointMember="YValue" FieldName="UnitPrice" />
                    <telerik:ItemMapping DataPointMember="XCategory" FieldName="ProductName" />

                </telerik:SeriesMapping.ItemMappings>
            </telerik:SeriesMapping>
        </telerik:RadChart.SeriesMappings>
        <telerik:RadChart.DefaultView>
            <telerik:ChartDefaultView>

                <telerik:ChartDefaultView.ChartTitle>
                    <telerik:ChartTitle HorizontalAlignment="Center" Content="Year 2009" />
                </telerik:ChartDefaultView.ChartTitle>

                <telerik:ChartDefaultView.ChartLegend>
                    <telerik:ChartLegend x:Name="chartLegend" UseAutoGeneratedItems="True" />
                </telerik:ChartDefaultView.ChartLegend>

                <telerik:ChartDefaultView.ChartArea>
                    <telerik:ChartArea LegendName="chartLegend">

                        <telerik:ChartArea.AxisX>
                            <telerik:AxisX LabelRotationAngle="45" />
                        </telerik:ChartArea.AxisX>

                        <telerik:ChartArea.AxisY>
                            <telerik:AxisY DefaultLabelFormat="C" />
                        </telerik:ChartArea.AxisY>

                    </telerik:ChartArea>
                </telerik:ChartDefaultView.ChartArea>
            </telerik:ChartDefaultView>
        </telerik:RadChart.DefaultView>
    </telerik:RadChart>
</Grid>
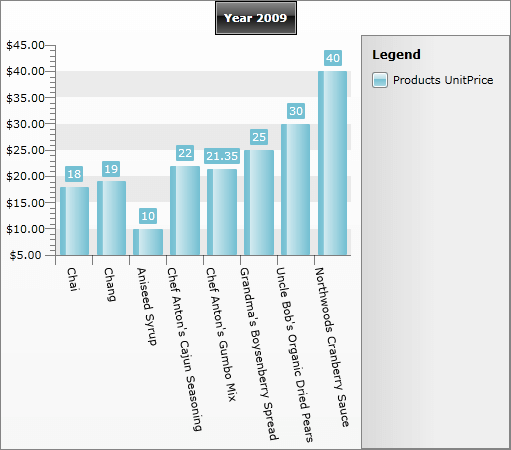
When the application (the user control) is loaded, the RadChart is populated with the first eight products from the Products table in the Northwind database. On the Y Axis is displayed the products UnitPrice. On the X Axis is displayed the ProductName property. This is done through the ItemsMapping property.
<telerik:RadChart.SeriesMappings>
    <telerik:SeriesMapping LegendLabel="Products UnitPrice">
        <telerik:SeriesMapping.SeriesDefinition>
            <telerik:BarSeriesDefinition />
        </telerik:SeriesMapping.SeriesDefinition>
        <telerik:SeriesMapping.ItemMappings>

            <telerik:ItemMapping DataPointMember="YValue" FieldName="UnitPrice" />
            <telerik:ItemMapping DataPointMember="XCategory" FieldName="ProductName" />

        </telerik:SeriesMapping.ItemMappings>
    </telerik:SeriesMapping>
</telerik:RadChart.SeriesMappings>
Also the products' names are rotated on 45 degrees. In order to do that you should use the LabelRotationAngle property of the XAxis. Here is the XAML which does it:
<telerik:RadChart x:Name="radChart"
                  Margin="8"
                  ItemsSource="{Binding}">
    <telerik:RadChart.SeriesMappings>
        <telerik:SeriesMapping LegendLabel="Quantity">
            <telerik:SeriesMapping.ItemMappings>
                <telerik:ItemMapping DataPointMember="YValue" FieldName="Quantity" />
            </telerik:SeriesMapping.ItemMappings>
        </telerik:SeriesMapping>
    </telerik:RadChart.SeriesMappings>
    <telerik:RadChart.DefaultView>
        <telerik:ChartDefaultView>
            <telerik:ChartDefaultView.ChartTitle>
                <telerik:ChartTitle HorizontalAlignment="Center" Content="Ordered Quantity" />
            </telerik:ChartDefaultView.ChartTitle>
        </telerik:ChartDefaultView>
    </telerik:RadChart.DefaultView>
</telerik:RadChart>
- The NorthwindDataSource class is used for ItemsSource of the RadChart.
<telerik:RadChart x:Name="radChart"
                  Margin="8"
                  ItemsSource="{Binding Source={StaticResource DataSource},
                                        Path=Products}" />
It has two properties of type ObservableCollection:
Products - displayed during the initial load of the RadChart.
OrderDetails- displayed as a tooltip for a specific product in the chart. More detailed information about the order details is displayed when the user clicks on a chart item.
public class NorthwindDataSource
{
    private static NorthwindEntities northwindEntity;
    public NorthwindDataSource()
    {
        northwindEntity = new NorthwindEntities( new Uri( "http://localhost:52981/Services/SampleAdoNetDataService.svc/" ) );
        this.Products = new ObservableCollection<Products>();
    }
    public ObservableCollection<Products> Products
    {
        get;
        set;
    }
    public ObservableCollection<Order_Details> OrderDetails
    {
        get;
        set;
    }
    public static void LoadOrderDetails(object param1, object param2)
    {
    }
    public static void BeginLoadingOrderDetails(object param1, object param2)
    {
    }
}
Public Class NorthwindDataSource
    Private Shared northwindEntity As NorthwindEntities

    Public Sub New()
        northwindEntity = New NorthwindEntities(New Uri("http://localhost:52981/Services/SampleAdoNetDataService.svc/"))
        Me.Products = New ObservableCollection(Of Products)()
    End Sub

    Private _Products As ObservableCollection(Of Products)
    Public Property Products() As ObservableCollection(Of Products)
        Get
            Return _Products
        End Get
        Set(ByVal value As ObservableCollection(Of Products))
            _Products = value
        End Set
    End Property

    Private _OrderDetails As ObservableCollection(Of Order_Details)
    Public Property OrderDetails() As ObservableCollection(Of Order_Details)
        Get
            Return _OrderDetails
        End Get
        Set(ByVal value As ObservableCollection(Of Order_Details))
            _OrderDetails = value
        End Set
    End Property
End Class
Here is the initial loading of the products. The code is placed in the NorthwindDataSource constructor:
public NorthwindDataSource()
{
    northwindEntity = new NorthwindEntities( new Uri( "http://localhost:52981/Services/SampleAdoNetDataService.svc/" ) );
    this.Products = new ObservableCollection<Products>();
    var query = ( from p in northwindEntity.Products
                  select p ).Take( 8 );
    DataServiceQuery<Products> products = ( DataServiceQuery<Products> )query;
    products.BeginExecute(
        (IAsyncResult result) => { EntitiesLoaded<Products>(result, this.Products); }, products);
}
public NorthwindDataSource()
{
    northwindEntity = new NorthwindEntities(new Uri("http://localhost:52981/Services/SampleAdoNetDataService.svc/"));
    this.Products = new ObservableCollection<Products>();

    foreach ( Products p in northwindEntity.Products.Execute().Take( 8 ) )
    {
        this.Products.Add( p );
    }
}
Public Sub New()
    northwindEntity = New NorthwindEntities(New Uri("http://localhost:52981/Services/SampleAdoNetDataService.svc/"))
    Me.Products = New ObservableCollection(Of Products)()

    For Each p As Products In northwindEntity.Products.Execute().Take(8)
        Me.Products.Add(p)
    Next
End Sub
Public Sub New()
    northwindEntity = New NorthwindEntities(New Uri("http://localhost:52981/Services/SampleAdoNetDataService.svc/"))
    Me.Products = New ObservableCollection(Of Products)()

    Dim query = (From p In northwindEntity.Products _
        Select p).Take(8)
    Dim products As DataServiceQuery(Of Products) = DirectCast(query, DataServiceQuery(Of Products))
End Sub
' #endregion

Public Products As ObservableCollection(Of Products)

'#region radchart-how-to-drill-down-chart_11
Private Shared Sub EntitiesLoaded(Of T)(ByVal result As IAsyncResult, ByVal entities As Collection(Of T))
    Dim query As DataServiceQuery(Of T) = TryCast(result.AsyncState, DataServiceQuery(Of T))
    For Each entity As T In query.EndExecute(result)
        entities.Add(entity)
    Next
End Sub
And the EntitiesLoaded method:
private static void EntitiesLoaded<T>( IAsyncResult result, Collection<T> entities )
{
    DataServiceQuery<T> query = result.AsyncState as DataServiceQuery<T>;
    foreach ( T entity in query.EndExecute( result ) )
    {
        entities.Add( entity );
    }
}
Private Shared Sub EntitiesLoaded(Of T)(ByVal result As IAsyncResult, ByVal entities As Collection(Of T))
    Dim query As DataServiceQuery(Of T) = TryCast(result.AsyncState, DataServiceQuery(Of T))
    For Each entity As T In query.EndExecute(result)
        entities.Add(entity)
    Next
End Sub
The NorthwindDataSource class contains one more method. It is used to load order details per a specific product:
public static void BeginLoadingOrderDetails(Products p, int rowCount )
{
    var query = ( from od in northwindEntity.Order_Details.Expand("Orders")
                 where od.ProductID == p.ProductID
                 select od );
    if ( rowCount > -1 )
        query = query.Take( rowCount );
    DataServiceQuery<Order_Details> orderDetails = ( DataServiceQuery<Order_Details> )query;
    orderDetails.BeginExecute(
        ( IAsyncResult result ) => EntitiesLoaded<Order_Details>( result, p.Order_Details ), orderDetails );
}
public static void LoadOrderDetails( Products p, int rowCount )
{
    var query = ( from od in northwindEntity.Order_Details.Expand( "Orders" )
                  where od.ProductID == p.ProductID
                  select od );
    if ( rowCount > -1 )
        query = query.Take( rowCount );
    foreach (Order_Details orderDetail in query.ToList())
    {
        p.Order_Details.Add( orderDetail );
    }
}
Public Shared Sub LoadOrderDetails(ByVal p As Products, ByVal rowCount As Integer)
    Dim query = (From od In northwindEntity.Order_Details.Expand("Orders") _
        Where od.ProductID = p.ProductID _
        Select od)
    If rowCount > -1 Then
        query = query.Take(rowCount)
    End If

    For Each orderDetail As Order_Details In query.ToList()
        p.Order_Details.Add(orderDetail)
    Next
End Sub
Public Shared Sub BeginLoadingOrderDetails(ByVal p As Products, ByVal rowCount As Integer)
    Dim query = (From od In northwindEntity.Order_Details.Expand("Orders") _
        Where od.ProductID = p.ProductID _
        Select od)
    If rowCount > -1 Then
        query = query.Take(rowCount)
    End If

    Dim orderDetails As DataServiceQuery(Of Order_Details) = DirectCast(query, DataServiceQuery(Of Order_Details))
    orderDetails.BeginExecute(Sub(result As IAsyncResult) EntitiesLoaded(Of Order_Details)(result, p.Order_Details), orderDetails)
End Sub
- Enable ToolTip. In order to do that use the ShowItemToolTips property.
<telerik:SeriesMapping.SeriesDefinition>
    <telerik:BarSeriesDefinition ShowItemToolTips="True" />
</telerik:SeriesMapping.SeriesDefinition>
- Attach to the ItemToolTipOpening event.
<telerik:ChartArea ItemToolTipOpening="ChartArea_ItemToolTipOpening" LegendName="chartLegend">
    <telerik:ChartArea.AxisX>
        <telerik:AxisX LabelRotationAngle="45" />
    </telerik:ChartArea.AxisX>
    <telerik:ChartArea.AxisY>
        <telerik:AxisY DefaultLabelFormat="C" />
    </telerik:ChartArea.AxisY>
</telerik:ChartArea>
<!-- #endregion-->
</telerik:RadChart>

<!-- #region radchart-how-to-drill-down-chart_25 -->
<telerik:ChartArea ItemClick="ChartArea_ItemClick"
               ItemToolTipOpening="ChartArea_ItemToolTipOpening"
               LegendName="chartLegend">
<telerik:ChartArea.AxisX>
    <telerik:AxisX LabelRotationAngle="45" />
</telerik:ChartArea.AxisX>
<telerik:ChartArea.AxisY>
    <telerik:AxisY DefaultLabelFormat="C" />
</telerik:ChartArea.AxisY>
</telerik:ChartArea>
Switch in the code-behind. Here is the code for the event handler:
private void ChartArea_ItemToolTipOpening( ItemToolTip2D tooltip, ItemToolTipEventArgs e )
{
    Products p = e.DataPoint.DataItem as Products;
    p.Order_Details = new ObservableCollection<Order_Details>();
    NorthwindDataSource.BeginLoadingOrderDetails( p, 6 );
    DrillDownChartToolTip toolTipControl = new DrillDownChartToolTip();
    toolTipControl.DataContext = p.Order_Details;
    tooltip.Content = toolTipControl;
}
private void ChartArea_ItemToolTipOpening(ItemToolTip2D tooltip, ItemToolTipEventArgs e)
{
    Products p = e.DataPoint.DataItem as Products;
    p.Order_Details = new ObservableCollection<Order_Details>();
    NorthwindDataSource.LoadOrderDetails(p, 6);
    DrillDownChartToolTip toolTipControl = new DrillDownChartToolTip();
    toolTipControl.DataContext = p.Order_Details;
    tooltip.Content = toolTipControl;
}
Private Sub ChartArea_ItemToolTipOpening(ByVal tooltip As ItemToolTip2D, ByVal e As ItemToolTipEventArgs)
    Dim p As Products = TryCast(e.DataPoint.DataItem, Products)
    p.Order_Details = New ObservableCollection(Of Order_Details)()
    NorthwindDataSource.LoadOrderDetails(p, 6)

    Dim toolTipControl As New DrillDownChartToolTip()
    toolTipControl.DataContext = p.Order_Details
    tooltip.Content = toolTipControl
End Sub
Private Sub ChartArea_ItemToolTipOpening(ByVal tooltip As ItemToolTip2D, ByVal e As ItemToolTipEventArgs)
    Dim p As Products = TryCast(e.DataPoint.DataItem, Products)
    p.Order_Details = New ObservableCollection(Of Order_Details)()
    NorthwindDataSource.BeginLoadingOrderDetails(p, 6)

    Dim toolTipControl As New DrillDownChartToolTip()
    toolTipControl.DataContext = p.Order_Details
    tooltip.Content = toolTipControl
End Sub
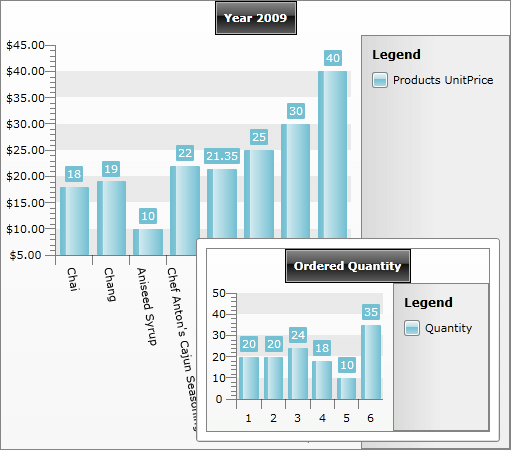
When the tooltip is opened, the underlying product is extracted first:
Products p = e.DataPoint.DataItem as Products;
Dim p As Products = TryCast(e.DataPoint.DataItem, Products)
Second, the BeginLoadingOrderDetails() method is invoked. Finally, a new instance of a user control is created and is set as a content of the tooltip.
You can see the result on the snapshot below:
Here is the XAML declaration of the DrillDownChartToolTip control, which is used as a tooltip content:
<telerik:RadChart x:Name="radChart"
                  Margin="8"
                  ItemsSource="{Binding}">
    <telerik:RadChart.SeriesMappings>
        <telerik:SeriesMapping LegendLabel="Quantity">
            <telerik:SeriesMapping.ItemMappings>
                <telerik:ItemMapping DataPointMember="YValue" FieldName="Quantity" />
            </telerik:SeriesMapping.ItemMappings>
        </telerik:SeriesMapping>
    </telerik:RadChart.SeriesMappings>
    <telerik:RadChart.DefaultView>
        <telerik:ChartDefaultView>
            <telerik:ChartDefaultView.ChartTitle>
                <telerik:ChartTitle HorizontalAlignment="Center" Content="Ordered Quantity" />
            </telerik:ChartDefaultView.ChartTitle>
        </telerik:ChartDefaultView>
    </telerik:RadChart.DefaultView>
</telerik:RadChart>
- The final step is to add the drill down behavior. To do that, attach to the ItemClick event.
<telerik:ChartArea ItemClick="ChartArea_ItemClick"
                   ItemToolTipOpening="ChartArea_ItemToolTipOpening"
                   LegendName="chartLegend">
    <telerik:ChartArea.AxisX>
        <telerik:AxisX LabelRotationAngle="45" />
    </telerik:ChartArea.AxisX>
    <telerik:ChartArea.AxisY>
        <telerik:AxisY DefaultLabelFormat="C" />
    </telerik:ChartArea.AxisY>
</telerik:ChartArea>
Switch in the code-behind. Add the code for handling the event. Here is a sample how this can be done:
private void ChartArea_ItemClick( object sender, ChartItemClickEventArgs e )
{
// Get the product and load all order details
Products selectedItem = ( e.DataPoint.DataItem as Products );
selectedItem.Order_Details = new ObservableCollection<Order_Details>();
radChart.ItemsSource = selectedItem.Order_Details;
NorthwindDataSource.BeginLoadingOrderDetails( selectedItem, -1 );
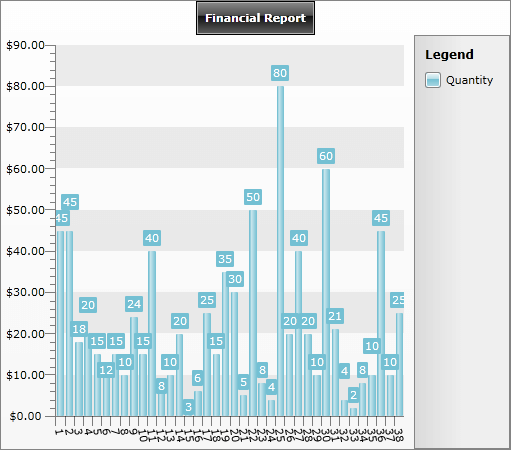
// Change the chart title
radChart.DefaultView.ChartTitle.Content = "Financial Report";
radChart.SeriesMappings.Clear();
// Change the Item mapping
SeriesMapping newSeriesMapping = new SeriesMapping();
newSeriesMapping.LegendLabel = "Quantity";
ItemMapping newItemMapping = new ItemMapping();
newItemMapping.FieldName = "Quantity";
newItemMapping.DataPointMember = DataPointMember.YValue;
newSeriesMapping.ItemMappings.Add( newItemMapping );
radChart.SeriesMappings.Add( newSeriesMapping );
}
private void ChartArea_ItemClick(object sender, ChartItemClickEventArgs e)
{
    // Get the product and load all order details
    Products selectedItem = (e.DataPoint.DataItem as Products);
    selectedItem.Order_Details = new ObservableCollection<Order_Details>();
    radChart.ItemsSource = selectedItem.Order_Details;
    NorthwindDataSource.LoadOrderDetails(selectedItem, -1);

    // Change the chart title
    radChart.DefaultView.ChartTitle.Content = "Financial Report";
    radChart.SeriesMappings.Clear();

    // Change the Item mapping
    SeriesMapping newSeriesMapping = new SeriesMapping();
    newSeriesMapping.LegendLabel = "Quantity";
    ItemMapping newItemMapping = new ItemMapping();
    newItemMapping.FieldName = "Quantity";
    newItemMapping.DataPointMember = DataPointMember.YValue;
    newSeriesMapping.ItemMappings.Add(newItemMapping);
    radChart.SeriesMappings.Add(newSeriesMapping);
}
Private Sub ChartArea_ItemClick(ByVal sender As Object, ByVal e As ChartItemClickEventArgs)
    ' Get the product and load all order details
    Dim selectedItem As Products = TryCast(e.DataPoint.DataItem, Products)
    selectedItem.Order_Details = New ObservableCollection(Of Order_Details)()
    radChart.ItemsSource = selectedItem.Order_Details
    NorthwindDataSource.LoadOrderDetails(selectedItem, -1)

    ' Change the chart title
    radChart.DefaultView.ChartTitle.Content = "Financial Report"
    radChart.SeriesMappings.Clear()

    ' Change the Item mapping
    Dim newSeriesMapping As New SeriesMapping()
    newSeriesMapping.LegendLabel = "Quantity"
    Dim newItemMapping As New ItemMapping()
    newItemMapping.FieldName = "Quantity"
    newItemMapping.DataPointMember = DataPointMember.YValue
    newSeriesMapping.ItemMappings.Add(newItemMapping)
    radChart.SeriesMappings.Add(newSeriesMapping)
End Sub
Private Sub ChartArea_ItemClick(ByVal sender As Object, ByVal e As ChartItemClickEventArgs)
    ' Get the product and load all order details
    Dim selectedItem As Products = TryCast(e.DataPoint.DataItem, Products)
    selectedItem.Order_Details = New ObservableCollection(Of Order_Details)()
    radChart.ItemsSource = selectedItem.Order_Details
    NorthwindDataSource.BeginLoadingOrderDetails(selectedItem, -1)

    ' Change the chart title '
    radChart.DefaultView.ChartTitle.Content = "Financial Report"
    radChart.SeriesMappings.Clear()

    ' Change the Item mapping '
    Dim newSeriesMapping As New SeriesMapping()
    newSeriesMapping.LegendLabel = "Quantity"
    Dim newItemMapping As New ItemMapping()
    newItemMapping.FieldName = "Quantity"
    newItemMapping.DataPointMember = DataPointMember.YValue
    newSeriesMapping.ItemMappings.Add(newItemMapping)
    radChart.SeriesMappings.Add(newSeriesMapping)
End Sub
When the user clicks on a specific item (product), some information about the order details will be displayed: