Add Annotations in Chart Legend
The following help article will demonstrate how to customize the Chart Legend so that Annotations - in this case a Custom GridLine can be added as Chart Legend Item.
1. Create CustomGridLine Style that has Line as TargetType. Currently the GridLine will be presented as dashed line by using the StrokeDashArray as Setter:
<Style x:Key="CustomGridLineStyle" TargetType="Line">
<Setter Property="StrokeDashArray" Value="3,1" />
<Setter Property="Stroke" Value="DarkBlue" />
<Setter Property="StrokeThickness" Value="2" />
</Style>
2. Customize the *ChartLegendItem *Style so that it will draw a Dashed Line as Legend Item Marker:
<controls:Office_BlackTheme x:Key="Theme" />

<Style x:Key="DashedLegendItem2" TargetType="charting:ChartLegendItem" controls:StyleManager.BasedOn="{StaticResource Theme}">
            <Setter Property="Template" >
                <Setter.Value>
                    <ControlTemplate TargetType="charting:ChartLegendItem">
                        <Grid x:Name="PART_MainContainer" HorizontalAlignment="Stretch" VerticalAlignment="Top">
                            <Grid.ColumnDefinitions>
                                <ColumnDefinition Width="Auto" />
                                <ColumnDefinition />
                            </Grid.ColumnDefinitions>
                            <Line Width="16"
                                  Margin="{TemplateBinding Margin}"
                                  Stroke="Gray"
                                  StrokeThickness="2"
                                  StrokeDashArray="3 1"
                                  X1 = "0" Y1 = "0"
                                  X2 = "10" Y2 = "0"
                                  Stretch="Fill" />

                            <TextBlock Grid.Column="1"
                             Padding="{TemplateBinding Padding}"
                             Margin="{TemplateBinding Margin}"
                             Foreground="{TemplateBinding Foreground}"
                             Text="{TemplateBinding Label}" />
                        </Grid>
                    </ControlTemplate>
                </Setter.Value>
            </Setter>
        </Style>
The ChartLegendItem style may be different for the older versions of the RadChart
3. Create a sample Chart and add CustomGridLine by applying the CustomGridLine Style:
InitializeComponent();
            DataSeries series1 = new DataSeries()
            {
                new DataPoint(40),
                new DataPoint(40),
                new DataPoint(40)
            };
            series1.Definition = new BarSeriesDefinition();

            DataSeries series2 = new DataSeries()
            {
                new DataPoint(80),
                new DataPoint(80),
                new DataPoint(80)
            };
            series2.Definition = new BarSeriesDefinition();

            CustomGridLine gridline = new CustomGridLine();
            gridline.YIntercept = 70;
            gridline.ElementStyle = this.Resources["CustomGridLineStyle"] as Style;
            RadChart1.DefaultView.ChartArea.Annotations.Add(gridline);

            RadChart1.DefaultView.ChartArea.PaletteBrushes.Add(new SolidColorBrush(Colors.Gray));
            RadChart1.DefaultView.ChartArea.PaletteBrushes.Add(new SolidColorBrush(Colors.Red));
            RadChart1.DefaultView.ChartArea.AxisX.LayoutMode = AxisLayoutMode.Inside;
            RadChart1.DefaultView.ChartArea.DataSeries.Add(series1);
            RadChart1.DefaultView.ChartArea.DataSeries.Add(series2);
InitializeComponent()
Dim series1 As New DataSeries() With { New DataPoint(40), New DataPoint(40), New DataPoint(40) }
series1.Definition = New BarSeriesDefinition()

Dim series2 As New DataSeries() With { New DataPoint(80), New DataPoint(80), New DataPoint(80) }
series2.Definition = New BarSeriesDefinition()

Dim gridline As New CustomGridLine()
gridline.YIntercept = 70
gridline.ElementStyle = TryCast(Me.Resources("CustomGridLineStyle"), Style)
RadChart1.DefaultView.ChartArea.Annotations.Add(gridline)

RadChart1.DefaultView.ChartArea.PaletteBrushes.Add(New SolidColorBrush(Colors.Gray))
RadChart1.DefaultView.ChartArea.PaletteBrushes.Add(New SolidColorBrush(Colors.Red))
RadChart1.DefaultView.ChartArea.AxisX.LayoutMode = AxisLayoutMode.Inside
RadChart1.DefaultView.ChartArea.DataSeries.Add(series1)
RadChart1.DefaultView.ChartArea.DataSeries.Add(series2)
4. Add the Chart Legend Items explicitly as shown in this help topic. The recently created LegendItemStyle is added for the ChartLegendItem that will show the CustomGridLine:
RadChart1.DefaultView.ChartLegend.UseAutoGeneratedItems = false;
ChartLegendItem item01 = new ChartLegendItem();
item01.MarkerFill = new SolidColorBrush(Colors.Gray);
item01.Label = "Bar Chart 1";
RadChart1.DefaultView.ChartLegend.Items.Add(item01);
ChartLegendItem item02 = new ChartLegendItem();
item02.MarkerFill = new SolidColorBrush(Colors.Red);
item02.Label = "Bar Chart 2";
RadChart1.DefaultView.ChartLegend.Items.Add(item02);
ChartLegendItem item2 = new ChartLegendItem();
item2.Label = "My CustomGridLine";
item2.Style = this.Resources["DashedLegendItem2"] as Style;
RadChart1.DefaultView.ChartLegend.Items.Add(item2);
RadChart1.DefaultView.ChartLegend.UseAutoGeneratedItems = False
                  Dim item01 As New ChartLegendItem()
                  item01.MarkerFill = New SolidColorBrush(Colors.Gray)
                  item01.Label = "Bar Chart 1"
                  RadChart1.DefaultView.ChartLegend.Items.Add(item01)
                  Dim item02 As New ChartLegendItem()
                  item02.MarkerFill = New SolidColorBrush(Colors.Red)
                  item02.Label = "Bar Chart 2"
                  RadChart1.DefaultView.ChartLegend.Items.Add(item02)
                  Dim item2 As New ChartLegendItem()
                  item2.Label = "My CustomGridLine"
                  item2.Style = TryCast(Me.Resources("DashedLegendItem2"), Style)
                  RadChart1.DefaultView.ChartLegend.Items.Add(item2)
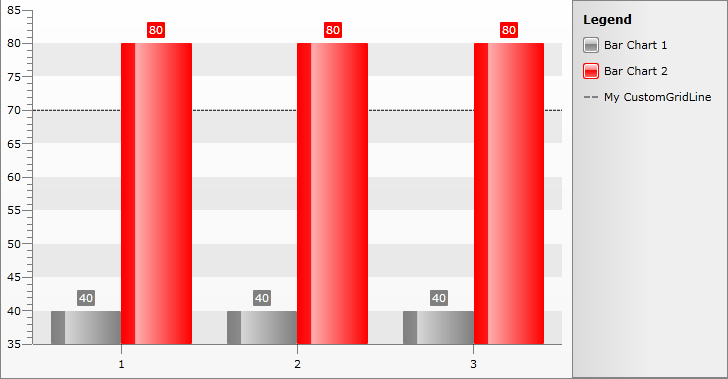
The result is shown below: