In Multiple Chart Areas
This is the other of displaying the drill down charts via the RadChart control. Compared to the one that uses a single chart area, this one makes use of multiple chart areas, which count depends on the levels of the hierarchy. Of course you can combine the both of them.
To make the RadChart display your hierarchical data in drill down form you have to use its HierarchicalViewDescriptors collection. To learn how please read the Hierarchical View topic. It explains the basics around the drill down feature of the RadChart and also gives some sampole data definitions. The same definitions are going to be used in the scope of this topic too.
In order to use multiple chart areas in your RadChart you have to disable the default layout. This is done by setting the UseDefaultLayout property of the RadChart to False.
To learn more about using multiple chart areas read this topic.
Now you are able to define more than one chart area inside the RadChart control. Here is a sample structure of a Grid that holds two ChartAreas.
<telerik:RadChart x:Name="radChart" UseDefaultLayout="False">
<Grid>
<Grid.RowDefinitions>
<RowDefinition Height="" />
<RowDefinition Height="" />
</Grid.RowDefinitions>
<telerik:ChartArea x:Name="CompanyChartArea" />
<telerik:ChartArea x:Name="ModelSalesChartArea"
Grid.Row="1"
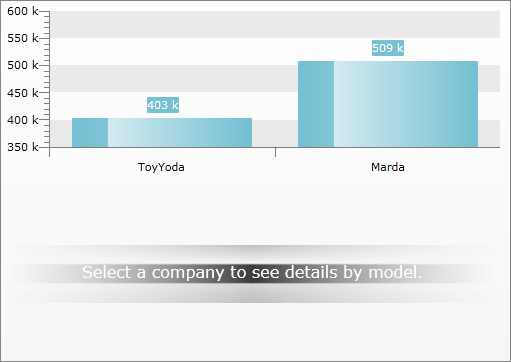
NoDataString="Select a company to see details by model." />
</Grid>
</telerik:RadChart>
The definition of the ChartHierarchicalViewDescriptor objects is the same as in the Hierarchical View topic, with the excpetion that each of the SeriesMapping objects is associated with the respective chart area.
You can associate multiple SeriesMapping objects belonging to different ChartHierarchicalViewDescriptor objects to one and the same ChartArea. You just have to set their ChartAreaName property to the respective chart area's name.
<telerik:RadChart x:Name="radChart" UseDefaultLayout="False">
    <Grid>
        <Grid.RowDefinitions>
            <RowDefinition Height="" />
            <RowDefinition Height="" />
        </Grid.RowDefinitions>
        <telerik:ChartArea x:Name="CompanyChartArea" />
        <telerik:ChartArea x:Name="ModelSalesChartArea"
                           Grid.Row="1"
                           NoDataString="Select a company to see details by model." />
    </Grid>
    <telerik:RadChart.HierarchicalViewDescriptors>
        <telerik:ChartHierarchicalViewDescriptor>
            <telerik:ChartHierarchicalViewDescriptor.SeriesMappings>
                <telerik:SeriesMapping ChartAreaName="CompanyChartArea">
                    <telerik:ItemMapping DataPointMember="YValue" FieldName="Sales.TotalAmount" />
                    <telerik:ItemMapping DataPointMember="XCategory" FieldName="Name" />
                </telerik:SeriesMapping>
            </telerik:ChartHierarchicalViewDescriptor.SeriesMappings>
        </telerik:ChartHierarchicalViewDescriptor>
        <telerik:ChartHierarchicalViewDescriptor>
            <telerik:ChartHierarchicalViewDescriptor.Relation>
                <telerik:PropertyRelation ParentPropertyName="Sales" />
            </telerik:ChartHierarchicalViewDescriptor.Relation>
            <telerik:ChartHierarchicalViewDescriptor.SeriesMappings>
                <telerik:SeriesMapping ChartAreaName="ModelSalesChartArea">
                    <telerik:SeriesMapping.GroupingSettings>
                        <telerik:GroupingSettings ShouldFlattenSeries="True">
                            <telerik:ChartGroupDescriptor Member="Model" />
                        </telerik:GroupingSettings>
                    </telerik:SeriesMapping.GroupingSettings>
                    <telerik:ItemMapping AggregateFunction="Sum"
                                         DataPointMember="YValue"
                                         FieldName="Amount" />
                    <telerik:ItemMapping DataPointMember="XCategory" FieldName="Model" />
                </telerik:SeriesMapping>
            </telerik:ChartHierarchicalViewDescriptor.SeriesMappings>
        </telerik:ChartHierarchicalViewDescriptor>
    </telerik:RadChart.HierarchicalViewDescriptors>
</telerik:RadChart>
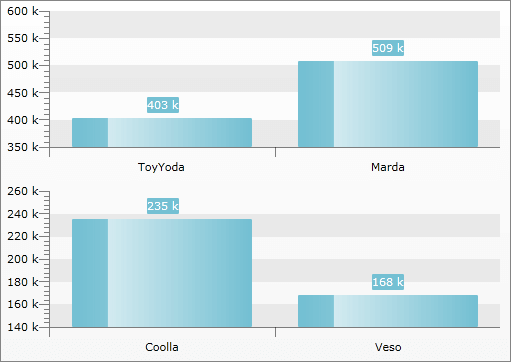
Here are snapshots of the result - one for the first hierarchy level and one after clicking on the ToyYoda bar.