.NET MAUI Chart Financial Indicators
The financial, or also called stock, indicators are used for keeping track of stock prices and patterns of price changes over time. For more information about what indicators are and what their purpose is, refer to the Short information about financial indicators article.
When using the indicators in the RadCartesianChart, you need to add them in the same way you add any other Cartesian series. Every indicator has a related formula by which it calculates the expected result. All you need to do is provide the needed data.
When setting their properties and getting them ready for displaying your stock data, consider the following financial indicators types:
-
Indicators that have a category and a value binding (usually the close one) as well as one or more periods:
OscillatorIndicatorRateOfChangeIndicatorRelativeStrengthIndexIndicatorTrixIndicatorWeightedMovingAverageIndicatorExponentialMovingAverageIndicatorAdaptiveMovingAverageKaufmanIndicatorBollingerBandsIndicatorRelativeMomentumIndexIndicatorMacdIndicator
-
Indicators that have a category and high, low, or close value bindings as well as none, one, or more periods:
AverageTrueRangeIndicatorCommodityChannelIndexIndicatorStochasticFastIndicatorStochasticSlowIndicatorTrueRangeIndicatorUltimateOscillatorIndicator
Example
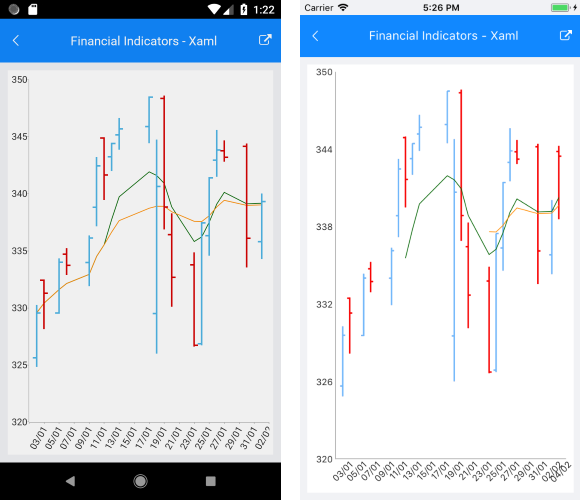
The following example shows how to create a basic RadCartesianChart with an OHLC Series and how to set some ExponentialMovingAverageIndicator instances with different periods.
1. Define the RadCartesianChart.
<telerik:RadCartesianChart PaletteName="Light"
                           SelectionPaletteName="LightSelected"
                           BackgroundColor="White" >
    <telerik:RadCartesianChart.BindingContext>
        <local:ViewModel />
    </telerik:RadCartesianChart.BindingContext>
    <telerik:RadCartesianChart.HorizontalAxis>
        <telerik:DateTimeContinuousAxis LineColor="#A9A9A9"
                                        LabelFitMode="Rotate"
                                        LabelFormat="dd/MM"
                                        PlotMode="BetweenTicks"
                                        MajorStep="2"
                                        MajorStepUnit="Day"/>
    </telerik:RadCartesianChart.HorizontalAxis>
    <telerik:RadCartesianChart.VerticalAxis>
        <telerik:NumericalAxis LineColor="#A9A9A9"
                               Minimum="320"
                               Maximum="350"
                               MajorTickBackgroundColor="#A9A9A9" />
    </telerik:RadCartesianChart.VerticalAxis>
    <telerik:RadCartesianChart.Series>
        <telerik:OhlcSeries CategoryBinding="Category"
                            DisplayName="AppleStocks-OHLC"
                            OpenBinding="Open"
                            HighBinding="High"
                            LowBinding="Low"
                            CloseBinding="Close"
                            ItemsSource="{Binding SeriesData}"/>

        <telerik:ExponentialMovingAverageIndicator CategoryBinding="Category"
                                                   DisplayName="EMA 7days"
                                                   ValueBinding="Close"
                                                   Period="7"
                                                   StrokeThickness="1"
                                                   Stroke="DarkGreen"
                                                   ItemsSource="{Binding SeriesData}"/>

        <telerik:ExponentialMovingAverageIndicator CategoryBinding="Category"
                                                   DisplayName="EMA 14days"
                                                   ValueBinding="Close"
                                                   Period="14"
                                                   StrokeThickness="1"
                                                   Stroke="DarkOrange"
                                                   ItemsSource="{Binding SeriesData}"/>
    </telerik:RadCartesianChart.Series>
</telerik:RadCartesianChart>
2. Define the business model:
public class OhlcDataPoint : NotifyPropertyChangedBase
{
    private DateTime category;
    private double open;
    private double high;
    private double low;
    private double close;

    public DateTime Category
    {
        get { return this.category; }
        set
        {
            if (value != this.category)
            {
                this.category = value;
                this.OnPropertyChanged();
            }
        }
    }

    public double Open
    {
        get { return this.open; }
        set
        {
            if (value != this.open)
            {
                this.open = value;
                this.OnPropertyChanged();
            }
        }
    }

    public double High
    {
        get { return this.high; }
        set
        {
            if (value != this.high)
            {
                this.high = value;
                this.OnPropertyChanged();
            }
        }
    }

    public double Low
    {
        get { return this.low; }
        set
        {
            if (value != this.low)
            {
                this.low = value;
                this.OnPropertyChanged();
            }
        }
    }

    public double Close
    {
        get { return this.close; }
        set
        {
            if (value != this.close)
            {
                this.close = value;
                this.OnPropertyChanged();
            }
        }
    }
}
3. And the ViewModel:
public class ViewModel
{
    public ViewModel()
    {
        this.SeriesData = LoadData();
    }

    public ObservableCollection<OhlcDataPoint> SeriesData { get; private set; }

    public ObservableCollection<OhlcDataPoint> LoadData()
    {
        ObservableCollection<OhlcDataPoint> points = new ObservableCollection<OhlcDataPoint>();

        points.Add(new OhlcDataPoint(){ Category =  DateTime.ParseExact("03-01-2011", "dd-MM-yyyy", null), Open = 325.64, High = 330.26, Low = 324.84, Close = 329.57 });
        points.Add(new OhlcDataPoint(){ Category =  DateTime.ParseExact("04-01-2011", "dd-MM-yyyy", null), Open = 332.44, High = 332.50, Low = 328.15, Close = 331.29 });
        points.Add(new OhlcDataPoint(){ Category =  DateTime.ParseExact("06-01-2011", "dd-MM-yyyy", null), Open = 329.55, High = 334.34, Low = 329.50, Close = 334.00 });
        points.Add(new OhlcDataPoint(){ Category =  DateTime.ParseExact("07-01-2011", "dd-MM-yyyy", null), Open = 334.72, High = 335.25, Low = 332.90, Close = 333.73 });
        points.Add(new OhlcDataPoint(){ Category =  DateTime.ParseExact("10-01-2011", "dd-MM-yyyy", null), Open = 333.99, High = 336.35, Low = 331.90, Close = 336.12 });
        points.Add(new OhlcDataPoint(){ Category =  DateTime.ParseExact("11-01-2011", "dd-MM-yyyy", null), Open = 338.83, High = 343.23, Low = 337.17, Close = 342.45 });
        points.Add(new OhlcDataPoint(){ Category =  DateTime.ParseExact("12-01-2011", "dd-MM-yyyy", null), Open = 344.88, High = 344.96, Low = 339.47, Close = 341.64 });
        points.Add(new OhlcDataPoint(){ Category =  DateTime.ParseExact("13-01-2011", "dd-MM-yyyy", null), Open = 343.25, High = 344.43, Low = 342.00, Close = 344.42 });
        points.Add(new OhlcDataPoint(){ Category =  DateTime.ParseExact("14-01-2011", "dd-MM-yyyy", null), Open = 345.16, High = 346.64, Low = 343.85, Close = 345.68 });
        points.Add(new OhlcDataPoint(){ Category =  DateTime.ParseExact("18-01-2011", "dd-MM-yyyy", null), Open = 345.89, High = 348.48, Low = 344.44, Close = 348.48 });
        points.Add(new OhlcDataPoint(){ Category =  DateTime.ParseExact("19-01-2011", "dd-MM-yyyy", null), Open = 329.52, High = 344.76, Low = 326.00, Close = 340.65 });
        points.Add(new OhlcDataPoint(){ Category =  DateTime.ParseExact("20-01-2011", "dd-MM-yyyy", null), Open = 348.35, High = 348.60, Low = 336.88, Close = 338.84 });
        points.Add(new OhlcDataPoint(){ Category =  DateTime.ParseExact("21-01-2011", "dd-MM-yyyy", null), Open = 336.43, High = 338.30, Low = 330.12, Close = 332.68 });
        points.Add(new OhlcDataPoint(){ Category =  DateTime.ParseExact("24-01-2011", "dd-MM-yyyy", null), Open = 333.77, High = 334.88, Low = 326.63, Close = 326.72 });
        points.Add(new OhlcDataPoint(){ Category =  DateTime.ParseExact("25-01-2011", "dd-MM-yyyy", null), Open = 326.87, High = 337.45, Low = 326.72, Close = 337.45 });
        points.Add(new OhlcDataPoint(){ Category =  DateTime.ParseExact("26-01-2011", "dd-MM-yyyy", null), Open = 336.33, High = 341.44, Low = 334.57, Close = 341.40});
        points.Add(new OhlcDataPoint(){ Category =  DateTime.ParseExact("27-01-2011", "dd-MM-yyyy", null), Open = 342.96, High = 345.60, Low = 341.50, Close = 343.85 });
        points.Add(new OhlcDataPoint(){ Category =  DateTime.ParseExact("28-01-2011", "dd-MM-yyyy", null), Open = 343.78, High = 344.69, Low = 342.83, Close = 343.21 });
        points.Add(new OhlcDataPoint(){ Category =  DateTime.ParseExact("31-01-2011", "dd-MM-yyyy", null), Open = 344.17, High = 344.40, Low = 333.53, Close = 336.10 });
        points.Add(new OhlcDataPoint(){ Category =  DateTime.ParseExact("02-02-2011", "dd-MM-yyyy", null), Open = 335.8,  High = 340.04, Low = 334.30, Close = 339.32 });
        points.Add(new OhlcDataPoint(){ Category =  DateTime.ParseExact("03-02-2011", "dd-MM-yyyy", null), Open = 343.8, High = 344.24, Low = 338.55, Close = 343.44 });

        return points;
    }
}
The following image shows the end result: