UI for iOS has been discontinued. Please refer to this page for more information.
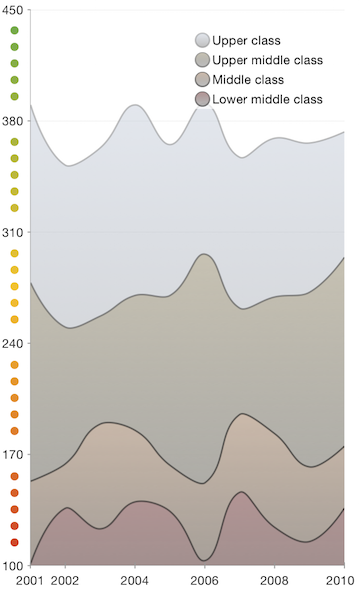
The TKChartAxis is responsible for TKChart's axes. You can set custom ticks and color the axis partially by using its property customLabels.
_chart.yAxis.customLabels = @{
                              @100 :[UIColor blueColor],
                              @200 : [UIColor colorWithRed:1.00 green:0.89 blue:0.20 alpha:1.0],
                              @400: [UIColor colorWithRed:0.00 green:0.90 blue:0.42 alpha:1.0]};
chart.yAxis!.customLabels = [100: UIColor.blue, 200: UIColor(red: 0.96, green: 0.00, blue: 0.22, alpha: 1.0), 400: UIColor(red: 0.00, green: 0.90, blue: 0.42, alpha: 1.0)]
this.chart.YAxis.CustomLabels = new NSDictionary(new NSNumber(100), UIColor.Blue,
    new NSNumber(200), UIColor.Yellow,
    new NSNumber(400), UIColor.Red);

TKChartAxis can have a custom render that you would use for drawing an axis completery by your taste. For the porpouse a new custom Axis should be created that derives from TKChartAxisRender and it's method renderForChart should be overriten:
@implementation MyAxis

- (TKChartAxisRender *)renderForChart:(TKChart *)chart
{
    return [[AxisRender alloc] initWithAxis:self chart:chart];
}

@end
class MyAxis: TKChartNumericAxis {
    override func render(for chart: TKChart) -> TKChartAxisRender {
        return AxisRender(axis: self, chart: chart)
    }
}
class MyAxis : TKChartNumericAxis
{
    public MyAxis (NSNumber minimum, NSNumber maximum)
        : base(minimum, maximum)
    {
    }

    public override TKChartAxisRender Render (TKChart chart)
    {                return new AxisRender (this, chart);
    }
}
Once this is done you are ready to start drawing in the -drawInContext method of your new axis render:
@implementation AxisRender

-(void)drawInContext:(CGContextRef)ctx
{
    CGRect rect = [self boundsRect];

    CGColorSpaceRef colorSpace = CGColorSpaceCreateDeviceRGB();
    CGFloat colors [] = {
        0.42, 0.66, 0.31, 1.0,
        0.95, 0.76, 0.20, 1.0,
        0.80, 0.25, 0.15, 1.0
    };

    CGGradientRef gradient = CGGradientCreateWithColorComponents(colorSpace, colors, NULL, 3);
    CGColorSpaceRelease(colorSpace);
    colorSpace = NULL;

    NSInteger tickSpaces = self.axis.majorTickCount - 1;
    NSInteger pointsCount = 5;
    if (self.chart.frame.size.height < self.chart.frame.size.width) {
        pointsCount = 3;
    }

    CGFloat diameter = 8;
    CGFloat spaceHeight = rect.size.height / tickSpaces;
    CGFloat spacing = (spaceHeight - (pointsCount * diameter)) / (pointsCount + 1);
    NSInteger allPointsCount = pointsCount * tickSpaces;
    CGMutablePathRef multipleCirclePath = CGPathCreateMutable();
    double y = CGRectGetMinY(rect) +  diameter / 2.0  + spacing;
    for (int i = 1; i <= allPointsCount; i++) {
        CGPoint center = CGPointMake(CGRectGetMidX(rect), y);
        CGMutablePathRef path = CGPathCreateMutable();
        CGPathAddArc(path, NULL, center.x, center.y, diameter / 2.0, 0, M_PI * 2, YES);

        CGPathAddPath(multipleCirclePath, NULL, path);
        y += spacing + diameter;
        if (i % pointsCount == 0) {
            y += spacing;
        }

        CGPathRelease(path);
    }

    CGContextSaveGState(ctx);
    CGContextAddPath(ctx, multipleCirclePath);
    CGContextClip(ctx);
    CGPoint startPoint = CGPointMake(CGRectGetMidX(rect), CGRectGetMinY(rect));
    CGPoint endPoint = CGPointMake(CGRectGetMidX(rect), CGRectGetMaxY(rect));
    CGContextDrawLinearGradient(ctx, gradient, startPoint, endPoint, 0);
    CGGradientRelease(gradient);
    gradient = NULL;
    CGContextRestoreGState(ctx);
    CGPathRelease(multipleCirclePath);
    [super drawInContext:ctx];
}

@end
class AxisRender: TKChartAxisRender {

    override func draw(in ctx: CGContext) {
        let rect = self.boundsRect()

        let colorSpace = CGColorSpaceCreateDeviceRGB()
        let colors: [CGFloat] = [
            0.42, 0.66, 0.31, 1.0,
            0.95, 0.76, 0.20, 1.0,
            0.80, 0.25, 0.15, 1.0]

        let gradient = CGGradient(colorSpace: colorSpace, colorComponents: colors, locations: nil, count: 3)

        let tickSpaces = self.axis!.majorTickCount - 1
        var pointsCount: UInt = 5
        if self.chart!.frame.size.height < self.chart!.frame.size.width {
            pointsCount = 3
        }

        let diameter: UInt = 8
        let spaceHeight = rect.size.height / CGFloat(tickSpaces)
        let spacing = (spaceHeight - CGFloat(pointsCount * diameter)) / CGFloat(pointsCount + 1)
        let allPointsCount = pointsCount * tickSpaces
        let multipleCirclePath = CGMutablePath()
        var y = rect.minY + CGFloat(diameter) / 2.0 + spacing
        for i in 1 ... allPointsCount {
            let center = CGPoint(x: rect.midX, y: y)
            let path = CGMutablePath()

            path.addArc(center: center, radius: CGFloat(diameter) / 2.0,
                        startAngle: 0, endAngle: CGFloat(M_PI * 2.0), clockwise: true)
            multipleCirclePath.addPath(path)
            y += spacing + CGFloat(diameter)
            if i % pointsCount == 0 {
                y += spacing
            }
        }

        ctx.saveGState()
        ctx.addPath(multipleCirclePath)
        ctx.clip()
        let startPoint = CGPoint(x: rect.midX, y: rect.minY)
        let endPoint = CGPoint(x: rect.midX, y: rect.maxY)
        ctx.drawLinearGradient(gradient!, start: startPoint, end: endPoint, options: CGGradientDrawingOptions.drawsAfterEndLocation)
        ctx.restoreGState()
        super.draw(in: ctx)
    }

}
public class AxisRender: TKChartAxisRender
{
    public AxisRender (TKChartAxis axis, TKChart chart)
        : base(axis, chart)
    {
    }

    public override void DrawInContext (CoreGraphics.CGContext ctx)
    {
        CGRect rect = this.BoundsRect();
        CGColorSpace colorSpace = CGColorSpace.CreateDeviceRGB ();
        nfloat [] colors = new nfloat[] {
            0.42f, 0.66f, 0.31f, 1.0f,
            0.95f, 0.76f, 0.20f, 1.0f,
            0.80f, 0.25f, 0.15f, 1.0f
        };

        CGGradient gradient = new CGGradient (colorSpace, colors, null);

        nuint tickSpaces = this.Axis.MajorTickCount - 1;
        nuint pointsCount = 5;
        if (this.Chart.Frame.Size.Height < this.Chart.Frame.Size.Width) {
            pointsCount = 3;
        }

        nfloat diameter = 8;
        nfloat spaceHeight = rect.Size.Height / tickSpaces;
        nfloat spacing = (spaceHeight - (pointsCount * diameter)) / (pointsCount + 1);
        nuint allPointsCount = pointsCount * tickSpaces;
        CGPath multipleCirclePath = new CGPath ();
        double y = rect.GetMinY() +  diameter / 2.0f  + spacing;

        for (uint i = 1; i <= allPointsCount; i++) {
            CGPoint center = new CGPoint (rect.GetMidX (), y);
            CGPath path = new CGPath ();
            path.AddArc (center.X, center.Y, (nfloat)diameter/2.0f, 0, (nfloat)Math.PI * 2, true);
            multipleCirclePath.AddPath (path);
            y += spacing + diameter;
            if (i % pointsCount == 0) {
                y += spacing;
            }
        }

        ctx.SaveState ();
        ctx.AddPath (multipleCirclePath);
        ctx.Clip ();
        CGPoint startPoint = new CGPoint (rect.GetMidX (), rect.GetMinY ());
        CGPoint endPoint = new CGPoint (rect.GetMidX (), rect.GetMaxY());
        ctx.DrawLinearGradient (gradient, startPoint, endPoint, 0);
        ctx.RestoreState ();

        base.DrawInContext (ctx);
    }

}