Logarithmic Axis
This help article explains how to use a logarithmic axis in the RadHtmlChart control. The feature is available since Q3 2014.
A logarithmic axis is a special numeric axis that transforms the actual values by using a logarithmic function with a particular base. The purpose of the logarithmic axis is to display values that cover different orders of magnitude in a more convenient way because it lets large values display together with small values in a more condensed scale than the default linear axis.
In order to configure a logarithmic axis in RadHtmlChart you must set the Type property of the Axis to "Log". You can control the base of the logarithm via the Step property (default value is 10).
Logarithmic scale can be used only for numerical data, so it cannot be used for a category or date axis. This means that the x-axis of anArea, Line, Bar and Column series cannot be put in logarithmic mode.
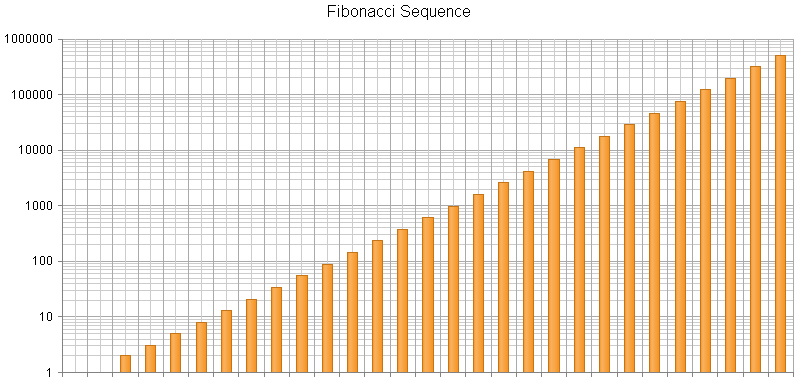
Example 1 shows how to configure a logarithmic y-axis in RadHtmlChart and Figure 1 displays the output.
Example 1: Configuring a logarithmic y-axis in a Column series that displays a Fibonacci sequence.
<telerik:RadHtmlChart ID="RadHtmlChart1" runat="server" Width="800px" Height="400px">
    <PlotArea>
        <YAxis Type="Log" Step="10"></YAxis>
        <Series>
            <telerik:ColumnSeries>
                <LabelsAppearance Visible="false"></LabelsAppearance>
            </telerik:ColumnSeries>
        </Series>
    </PlotArea>
    <ChartTitle Text="Fibonacci Sequence"></ChartTitle>
</telerik:RadHtmlChart>
protected void Page_Load(object sender, EventArgs e)
{
    if (!IsPostBack)
    {
        RadHtmlChart1.DataSource = GetFibonacciSequence(29);
        RadHtmlChart1.DataBind();
    }
}

protected List<int> GetFibonacciSequence(int n)
{
    List<int> data = new List<int>() { 1, 1 };
    for (int i = 2; i < n; i++)
    {
        data.Add(data[i - 2] + data[i - 1]);
    }
    return data;
}
Protected Sub Page_Load(sender As Object, e As EventArgs) Handles Me.Load
    If Not IsPostBack Then
        RadHtmlChart1.DataSource = GetFibonacciSequence(29)
        RadHtmlChart1.DataBind()
    End If
End Sub

Protected Function GetFibonacciSequence(n As Integer) As List(Of Integer)
    Dim data As New List(Of Integer)() From {1, 1}
    For i As Integer = 2 To n - 1
        data.Add(data(i - 2) + data(i - 1))
    Next
    Return data
End Function
Figure 1: Column series with a logarithmic y-axis.