How to Extend the Displayable Area for YAxis Data
RadChart has been replaced by RadHtmlChart, Telerik's client-side charting component. If you are considering RadChart for new development, examine the RadHtmlChart documentation and online demos first to see if it will fit your development needs. If you are already using RadChart in your projects, you can migrate to RadHtmlChart by following these articles: Migrating Series, Migrating Axes, Migrating Date Axes, Migrating Databinding, Features parity. Support for RadChart is discontinued as of Q3 2014, but the control will remain in the assembly so it can still be used. We encourage you to use RadHtmlChart for new development.
"My data touches the upper boundary of the plot area but that makes the data harder to see. How do I extend the viewable area along the YAxis?"
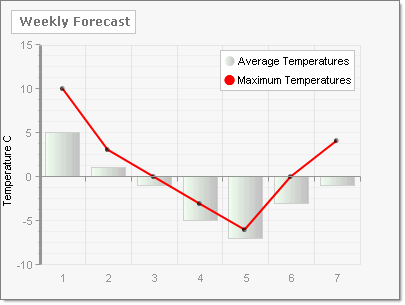
Assign the YAxis AxisMode property. By default the ChartYAxisMode property value is Normal and the YAxis data fills the available space.
myChart.PlotArea.YAxis.AxisMode = ChartYAxisMode.Normal;
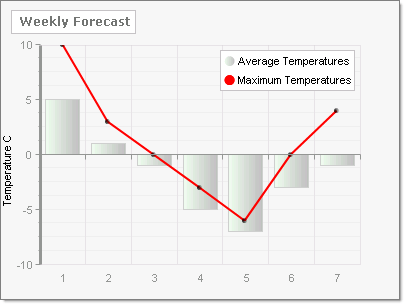
If you set the ChartYAxisMode to Extended, additional area is placed above the highest data point to make the chart easier to read.
myChart.PlotArea.YAxis.AxisMode = ChartYAxisMode.Extended;