In this article, you will learn to use the labels in RadChartView for Android: how to use the labels for the series and for the axes and how to customize them.
All series have their default labels. In order to display them, you simply need to set show labels of the series to true:
series.setShowLabels(true);
series.ShowLabels = true;
All axes have their default labels. They are visible by default. In order to hide them, you simply need to set show labels of the axis to false:
axis.setShowLabels(false);
axis.ShowLabels = false;
All axes and series have methods which provide various customization options for the labels:
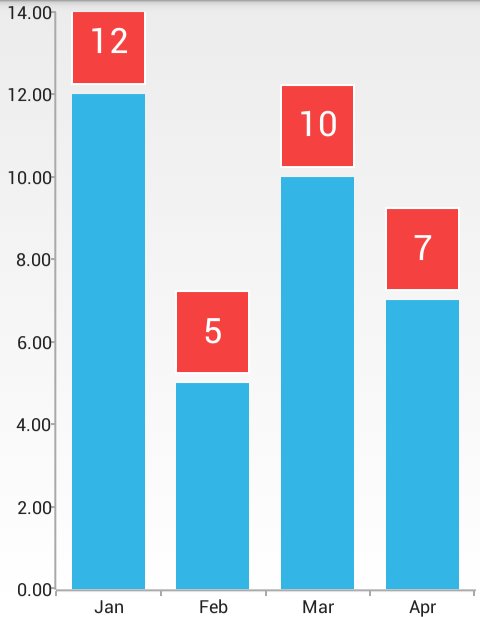
Additionally, you can provide a custom label render in order to completely change the way the labels are rendered. In order to set the renderer you need to use the setLabelRenderer(ChartLabelRenderer) method. Here's an excerpt from a custom label renderer:
private class CustomLabelRenderer extends BaseLabelRenderer {
    private String labelFormat = "%s";
    private TextPaint paint = new TextPaint();
    private Paint strokePaint = new Paint();
    private Paint fillPaint = new Paint();
    private float labelMargin = 10.0f;
    private float labelPadding = 20.0f;
    public CustomLabelRenderer(ChartSeries series) {
        super(series);
        this.strokePaint.setStyle(Paint.Style.STROKE);
        this.strokePaint.setColor(Color.WHITE);
        this.strokePaint.setStrokeWidth(2);
        this.fillPaint.setColor(0xffF5413F);
        this.paint.setTextSize(35.0f);
        this.paint.setColor(Color.WHITE);
    }
    @Override
    public void renderLabel(Canvas canvas, ChartNode relatedLabelNode) {
        CategoricalDataPoint dataPoint = (CategoricalDataPoint) relatedLabelNode;
        RadRect dataPointSlot = dataPoint.getLayoutSlot();
        Double val = dataPoint.getValue();
        String labelText = String.format(this.labelFormat, val.intValue());
        StaticLayout textInfo = this.createTextInfo(labelText, dataPoint);
        this.renderLabel(canvas, dataPointSlot, labelText, textInfo);
    }
    private StaticLayout createTextInfo(String labelText, CategoricalDataPoint dataPoint) {
        return new StaticLayout(labelText,
                0,
                labelText.length(),
                this.paint,
                Math.round((float) dataPoint.getLayoutSlot().getWidth()),
                Layout.Alignment.ALIGN_CENTER,
                1.0f,
                1.0f,
                false);
    }
    private void renderLabel(Canvas canvas, RadRect dataPointSlot, String labelText, StaticLayout textBounds) {
        RectF labelBounds = new RectF();
        float height = textBounds.getHeight() + this.labelPadding * 2;
        float top = (float) dataPointSlot.getY() - this.labelMargin - height;
        labelBounds.set((float) dataPointSlot.getX(),
                top,
                (float) dataPointSlot.getRight(),
                top + height);
        canvas.drawRect(labelBounds.left, labelBounds.top, labelBounds.right, labelBounds.bottom, this.fillPaint);
        canvas.drawRect(labelBounds.left, labelBounds.top, labelBounds.right, labelBounds.bottom, this.strokePaint);
        canvas.drawText(labelText, (float) dataPointSlot.getX() + (float) (dataPointSlot.getWidth() / 2.0) - textBounds.getLineWidth(0) / 2.0f,
        labelBounds.centerY() + textBounds.getLineBottom(0) - textBounds.getLineBaseline(0), paint);
    }
}
    class CustomLabelRenderer : BaseLabelRenderer {

        private String labelFormat = "{0}";
        private TextPaint paint = new TextPaint();
        private Paint strokePaint = new Paint();
        private Paint fillPaint = new Paint();
        private float labelMargin = 10.0f;
        private float labelPadding = 20.0f;

        public CustomLabelRenderer(ChartSeries owner)
            :base(owner) {

            this.strokePaint.SetStyle(Paint.Style.Stroke);
            this.strokePaint.Color = Color.White;
            this.strokePaint.StrokeWidth = 2;

            this.fillPaint.Color = Color.ParseColor("#F5413F");
            this.paint.TextSize = 35.0f;
            this.paint.Color = Color.White;
        }

        public override void RenderLabel (Canvas canvas,
            Com.Telerik.Widget.Chart.Engine.ElementTree.ChartNode relatedLabelNode) {

            CategoricalDataPoint dataPoint =
                relatedLabelNode.JavaCast<CategoricalDataPoint>();

            RadRect dataPointSlot = dataPoint.LayoutSlot;
            Double val = dataPoint.Value;
            String labelText = String.Format(this.labelFormat, (int)val);

            StaticLayout textInfo = this.CreateTextInfo(labelText, dataPoint);
            this.RenderLabel(canvas, dataPointSlot, labelText, textInfo);
        }

        private StaticLayout CreateTextInfo(String labelText,
            CategoricalDataPoint dataPoint) {

            return new StaticLayout(labelText,
                0,
                labelText.Length,
                this.paint,
                (int)Math.Round((float) dataPoint.LayoutSlot.Width),
                Layout.Alignment.AlignCenter,
                1.0f,
                1.0f,
                false);
        }

        private void RenderLabel(Canvas canvas, RadRect dataPointSlot,
            String labelText, StaticLayout textBounds) {

            RectF labelBounds = new RectF();
            float height = textBounds.Height + this.labelPadding * 2;
            float top = (float) dataPointSlot.GetY() - this.labelMargin - height;

            labelBounds.Set(
                (float) dataPointSlot.GetX(),
                top,
                (float) dataPointSlot.Right,
                top + height);

            canvas.DrawRect(
                labelBounds.Left,
                labelBounds.Top,
                labelBounds.Right,
                labelBounds.Bottom,
                this.fillPaint);

            canvas.DrawRect(
                labelBounds.Left,
                labelBounds.Top,
                labelBounds.Right,
                labelBounds.Bottom,
                this.strokePaint);

            canvas.DrawText(
                labelText,
                (float) dataPointSlot.GetX() + (float) (dataPointSlot.Width / 2.0) -
                    textBounds.GetLineWidth(0) / 2.0f,
                labelBounds.CenterY() + textBounds.GetLineBottom(0) -
                    textBounds.GetLineBaseline(0),
                paint);
        }
    }
And the result:
