In this article, you will learn how to display the grid lines in RadChartView for Android.
The CartesianChartGrid represents a decoration over the plot area of RadCartesianChartView. Adds major and minor lines, connected to each Major and Minor tick of each axis. You can set a new grid with the method setGrid(CartesianChartGrid) in your chart instance.
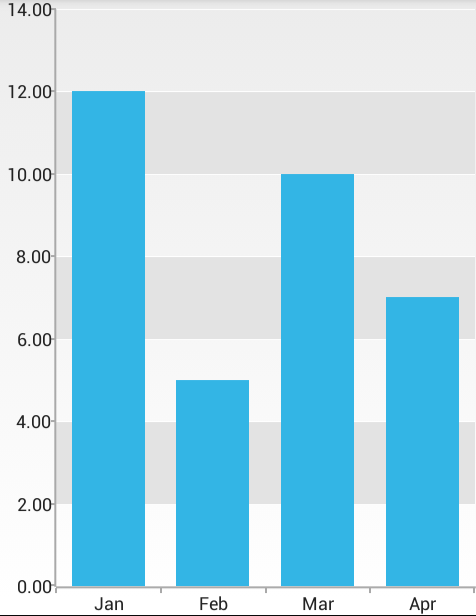
Here's an example of vertical lines in a chart with bar series:

In order to create such a chart you can start from the Bar Series Example and add the following code:
    CartesianChartGrid grid = new CartesianChartGrid();
    grid.setMajorYLinesRenderMode(GridLineRenderMode.INNER_AND_LAST);
    grid.setLineThickness(1);
    grid.setLineColor(Color.WHITE);
    grid.setMajorLinesVisibility(GridLineVisibility.Y);
    grid.setStripLinesVisibility(GridLineVisibility.Y);
    ObservableCollection<Paint> yBrushes = grid.getYStripeBrushes();
    yBrushes.clear();
    chartView.setGrid(grid);
    CartesianChartGrid grid = new CartesianChartGrid();
    grid.MajorYLinesRenderMode = GridLineRenderMode.InnerAndLast;
    grid.LineThickness = 1;
    grid.LineColor = Color.White;
    grid.MajorLinesVisibility = GridLineVisibility.Y;
    grid.StripLinesVisibility = GridLineVisibility.Y;
    ObservableCollection yBrushes = grid.YStripeBrushes;
    yBrushes.Clear();
    chartView.Grid = grid;
Now let's follow each line and see what it does. The method setMajorYLinesRenderMode(int) allows you to define which of the lines on the Y-axis will be drawn. You can choose from FIRST, INNER, LAST and their combinations. You can use the setMajorXLinesRenderMode(int) in a similar way for the vertical lines. setLineThickness(float) is used to change the thickness of the grid lines. setLineColor(int) is used to change the color of the grid lines. setMajorLinesVisibility(int) and setStripLinesVisibility(int) allow you to specify the visibility of the lines and the stripes, where stripe is the segment between two lines. The possible parameter values for both methods are GridLineVisibility.X, GridLineVisibility.Y, GridLineVisibility.NONE, GridLineVisibility.XY, which respectively set the display mode to: vertical lines, horizontal lines, no lines and lines in both directions. You can use the getYStripeBrushes() method to access the collection of paint objects used to draw the stripes. You can clear the collection and/or add custom Paint objects. You can use getXStripeBrushes() in a similar way for the vertical stripes.