Getting Started
RadChartView is essentially a toolset of charting components designed to help you create a variety of rich data-visualization applications. This tutorial will walk you through the creation of a sample application that contains a RadChartView component.
Chart Types
The RadChartView suite provides four different chart types.
- RadCartesianChart
- RadPieChart
- RadPolarChart
- RadFunnelChart
Each of these charting components is designed to best fit specific use cases. You can read more about the charts in the ChartTypes help article.
Assembly References
In order to use the controls from the RadChartView suite, you will need to add references to the following assemblies:
- Telerik.Windows.Controls
- Telerik.Windows.Controls.Chart
- Telerik.Windows.Data
You can find the required assemblies for each control from the UI for WPF suite in Controls Dependencies help article.
Defining a Chart
For demonstration purposes, this tutorial will use the RadCartesianChart component. It uses a Cartesian coordiante system to display different series and it is the most commonly used charting component. Example 1 demonstrates how to define the RadCartesianChart in XAML.
Example 1: Chart definition
<telerik:RadCartesianChart></telerik:RadCartesianChart>
The
teleriknamespace points to the telerik schema.xmlns:telerik="http://schemas.telerik.com/2008/xaml/presentation"
If you run the project at this stage, RadCartesianChart will inform you that there are no axes defined, as seen in Figure 1.
Figure 1: RadCartesianChart without its axes set
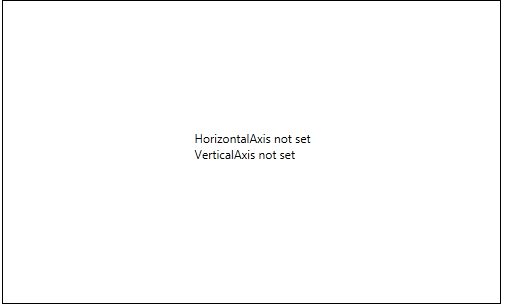
The Cartesian coordinate system is constructed using horizontal and vertical axes. RadChartView exposes different types of axes that can be combined horizontally and vertically in different ways based on the scenario. You can find more information about them in our Axis article.
This example will demonstrate a common scenario with a LinearAxis as the vertical axis of the chart and a CategoricalAxis as horizontal axis. Example 2 demonstrates how to define them in XAML.
Example 2: Chart axes definition
<telerik:RadCartesianChart>
    <telerik:RadCartesianChart.HorizontalAxis>
        <telerik:CategoricalAxis />
    </telerik:RadCartesianChart.HorizontalAxis>
    <telerik:RadCartesianChart.VerticalAxis>
        <telerik:LinearAxis/>
    </telerik:RadCartesianChart.VerticalAxis>
</telerik:RadCartesianChart>
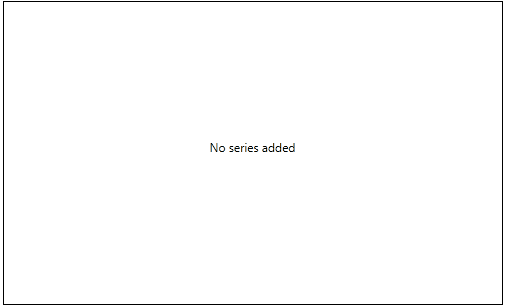
In the cases where no series are defined in the definition of the charting components, a message will be displayed to prompt you to enter a series.
Figure 2: RadCartesianChart without any series added in its Series collection
Defining a Series
RadChartView exposes a large variety of series that can be used in different scenarios. Please take a look at the Series article to find out more about the available types.
To complete the task of this tutorial, you need to define series with data points that will be rendered inside the charting component. You can do this by manually populating the Series collection of the RadCartesianChart control.
Example 3: Sample BarSeries definition
<telerik:RadCartesianChart>
    <telerik:RadCartesianChart.HorizontalAxis>
        <telerik:CategoricalAxis />
    </telerik:RadCartesianChart.HorizontalAxis>
    <telerik:RadCartesianChart.VerticalAxis>
        <telerik:LinearAxis/>
    </telerik:RadCartesianChart.VerticalAxis>

    <telerik:RadCartesianChart.Series>
        <telerik:BarSeries>
            <telerik:BarSeries.DataPoints>
                <telerik:CategoricalDataPoint Category="Apples" Value="20"/>
                <telerik:CategoricalDataPoint Category="Bananas" Value="28"/>
                <telerik:CategoricalDataPoint Category="Oranges" Value="17"/>
                <telerik:CategoricalDataPoint Category="Strawberries" Value="30"/>
            </telerik:BarSeries.DataPoints>
        </telerik:BarSeries>
    </telerik:RadCartesianChart.Series>
</telerik:RadCartesianChart>
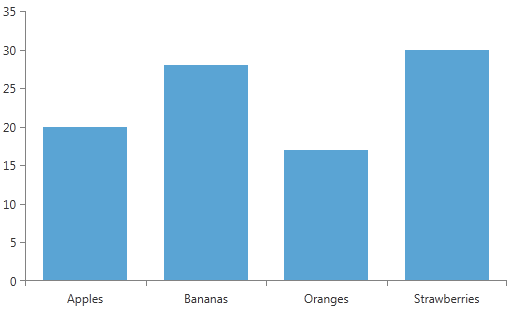
This chart definition will be rendered on the screen as demonstrated in Figure 3.
Figure 3: RadCartesianChart displaying a BarSeries
If you feel more confident working with code than with markup, you can achieve the same layout with the snippet from Example 4.
Example 4: Sample chart definition in code
RadCartesianChart chart = new RadCartesianChart();
CategoricalAxis catAxis = new CategoricalAxis();
LinearAxis lineAxis = new LinearAxis();
chart.HorizontalAxis = catAxis;
chart.VerticalAxis = lineAxis;

BarSeries barSeries = new BarSeries();
barSeries.DataPoints.Add(new CategoricalDataPoint() { Category = "Apples", Value = 20 });
barSeries.DataPoints.Add(new CategoricalDataPoint() { Category = "Bananas", Value = 28 });
barSeries.DataPoints.Add(new CategoricalDataPoint() { Category = "Oranges", Value = 17 });
barSeries.DataPoints.Add(new CategoricalDataPoint() { Category = "Strawberries", Value = 30 });
chart.Series.Add(barSeries);

this.LayoutRoot.Children.Add(chart);
Dim chart As New RadCartesianChart()
Dim catAxis As New CategoricalAxis()
Dim lineAxis As New LinearAxis()
chart.HorizontalAxis = catAxis
chart.VerticalAxis = lineAxis

Dim barSeries As New BarSeries()
barSeries.DataPoints.Add(New CategoricalDataPoint() With { Key .Category = "Apples", Key .Value = 20 })
barSeries.DataPoints.Add(New CategoricalDataPoint() With { Key .Category = "Bananas", Key .Value = 28 })
barSeries.DataPoints.Add(New CategoricalDataPoint() With { Key .Category = "Oranges", Key .Value = 17 })
barSeries.DataPoints.Add(New CategoricalDataPoint() With { Key .Category = "Strawberries", Key .Value = 30 })
chart.Series.Add(barSeries)

Me.LayoutRoot.Children.Add(chart)
In order to use the chartview components in code, you will need to add the required using directives that point to the Telerik namespaces.
Example 5: Required usings for the chartview components
using Telerik.Charting;
using Telerik.Windows.Controls;
using Telerik.Windows.Controls.ChartView;
Imports Telerik.Charting
Imports Telerik.Windows.Controls
Imports Telerik.Windows.Controls.ChartView
Bind the Chart
Although you can easily populate the RadCartesianChart Series directly with DataPoint objects, in most real-life applications, you will populate the series with business data. This is why all series types expose an ItemsSource property. You can bind that property to a collection of business items. And if you use a collection that implements the INotifyCollectionChanged interface, then any changes within the business data will be immediately reflected in the appropriate RadChartView components and vice versa. You can find more information in the Populating with Data section of our documentation.
Categorical vs Numerical Data
When choosing the correct series and axes to display your data, it is important to consider whether it is categorical or numerical. Here are some basic definitions for both types:
- Categorical Data: A type of data that can be stored into groups or categories with the aid of names or labels.
- Numerical Data: A type of data that is expressed in terms of numbers rather than natural language descriptions.
The RadChartView suite provides series and axes to display both kinds of data. You can check out the Series to Axes Dependencies article, which lists the different types of series and the axes that they support. Most series require one categorical and one numerical axis, however the Scatter type series support two numerical axes.