Profiler and Tuning Advisor - Overview
This article is relevant to entity models that utilize the deprecated Visual Studio integration of Telerik Data Access. The current documentation of the Data Access framework is available here.
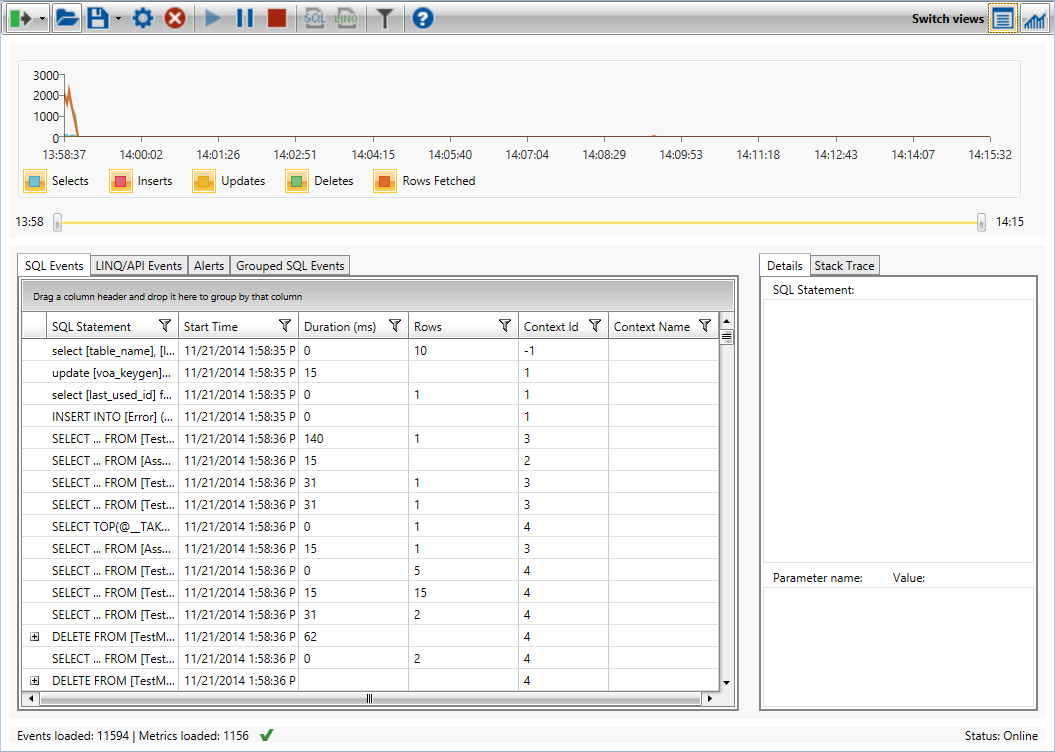
Telerik Data Access Profiler and Tuning Advisor is a graphical user interface for monitoring all the Telerik Data Access activity in your application. For example, you can monitor a production environment to see which queries are affecting performance by executing too slowly. The purpose of this section is to provide you a UI reference for the main views and commands in the Telerik Data Access Profiler.
Starting the Telerik Data Access Profiler and Tuning Advisor
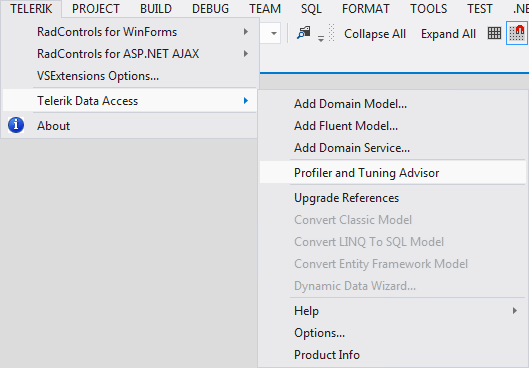
You could start the Telerik Data Access Profiler via the Telerik->Telerik Data Access->Profiler and Tuning Advisor menu command.
Or, you could start the profiler directly from the Telerik Data Access installation directory (~\Telerik\OpenAccess ORM\bin\Telerik.OpenAccess.Profiler.exe).
The topics in this section provide UI reference of the main views and commands in the Telerik Data Access Profiler and Tuning Advisor: