Navigator
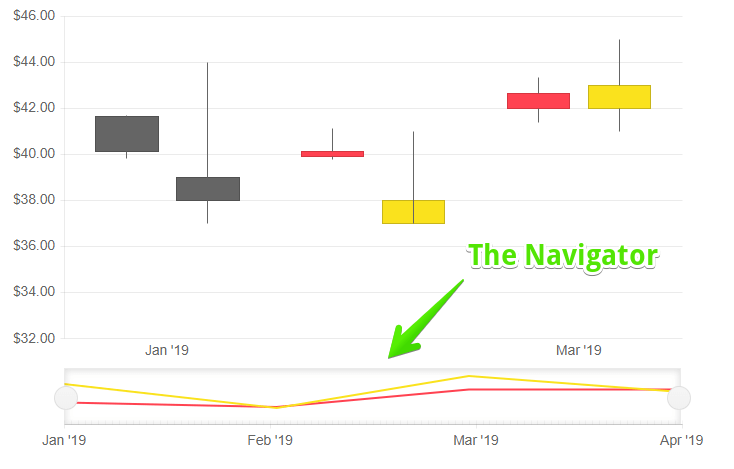
The Navigator allows the user to zoom or scroll through the data over a certain period of time. The Navigator can be used will all types of stock charts.
In this article you will find:
Basics
To enable data navigation you have to:
- set up a
<TelerikStockChart> - add a
<StockChartNavigator>inside the main<TelerikStockChart> - add a
<StockChartNavigatorSeries>to the<StockChartNavigatorSeriesItems>collection. - set its
Typeproperty to one of the following:StockChartSeriesType.ColumnStockChartSeriesType.AreaStockChartSeriesType.LineStockChartSeriesType.CandlestickStockChartSeriesType.OHCL
- provide a data model collection to its
Dataproperty. The data source should be the same as the one used for the<StockChartSeries>. - set the following properties depending on what
Typethe Navigator is: -
Column,AreaandLine-FieldandCategoryFieldto the corresponding fields in the model that carry the values -
OHLCandCandlestick-OpenField,ClosedField,HighFieldandLowFieldproperties to the corresponding fields in the model that carry the values.
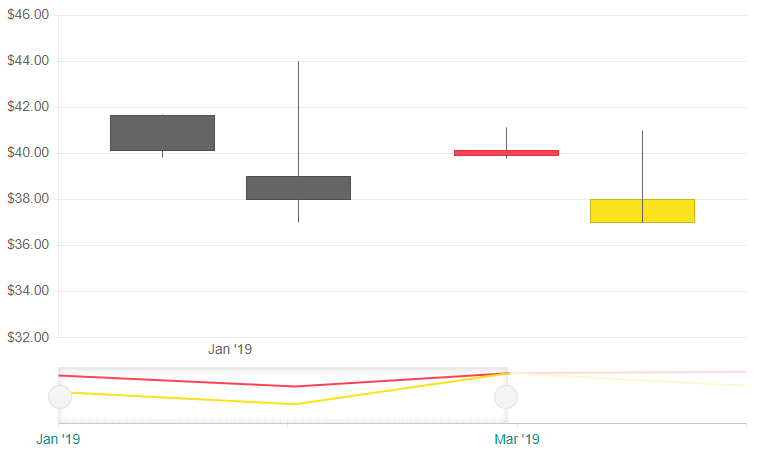
Data Navigation in a stock chart. Results from the first code snippet below.
@* Navigator basic setup *@

<TelerikStockChart Width="700px"
                   Height="450px"
                   DateField="@nameof(StockDataPoint.Date)">

    <StockChartNavigator>

        <StockChartNavigatorSeriesItems>
            <StockChartNavigatorSeries Type="StockChartSeriesType.Line"
                                       Name="Product 1"
                                       Data="@StockChartProduct1Data"
                                       Field="@nameof(StockDataPoint.High)"
                                       CategoryField="@nameof(StockDataPoint.Date)">
            </StockChartNavigatorSeries>

            <StockChartNavigatorSeries Type="StockChartSeriesType.Line"
                                       Name="Product 2"
                                       Data="@StockChartProduct2Data"
                                       Field="@nameof(StockDataPoint.High)"
                                       CategoryField="@nameof(StockDataPoint.Date)">
            </StockChartNavigatorSeries>
        </StockChartNavigatorSeriesItems>

    </StockChartNavigator>

    <StockChartCategoryAxes>
        <StockChartCategoryAxis BaseUnit="@ChartCategoryAxisBaseUnit.Months"></StockChartCategoryAxis>
    </StockChartCategoryAxes>

    <StockChartSeriesItems>
        <StockChartSeries Type="StockChartSeriesType.Candlestick"
                          Name="Product 1"
                          Data="@StockChartProduct1Data"
                          OpenField="@nameof(StockDataPoint.Open)"
                          CloseField="@nameof(StockDataPoint.Close)"
                          HighField="@nameof(StockDataPoint.High)"
                          LowField="@nameof(StockDataPoint.Low)">
            <StockChartSeriesTooltip Visible="false"></StockChartSeriesTooltip>
        </StockChartSeries>

        <StockChartSeries Type="StockChartSeriesType.Candlestick"
                          Name="Product 2"
                          Data="@StockChartProduct2Data"
                          OpenField="@nameof(StockDataPoint.Open)"
                          CloseField="@nameof(StockDataPoint.Close)"
                          HighField="@nameof(StockDataPoint.High)"
                          LowField="@nameof(StockDataPoint.Low)">
            <StockChartSeriesTooltip Visible="false"></StockChartSeriesTooltip>
        </StockChartSeries>
    </StockChartSeriesItems>

</TelerikStockChart>

@code {
    public List<StockDataPoint> StockChartProduct1Data { get; set; }
    public List<StockDataPoint> StockChartProduct2Data { get; set; }

    protected override async Task OnInitializedAsync()
    {
        await GenerateChartData();
    }

    public async Task GenerateChartData()
    {
        StockChartProduct1Data = new List<StockDataPoint>()
    {
            new StockDataPoint(new DateTime(2019, 1, 1), 41.62m, 40.12m, 41.69m, 39.81m, 2632000),
            new StockDataPoint(new DateTime(2019, 2, 1), 39.88m, 40.12m, 41.12m, 39.75m, 3584700),
            new StockDataPoint(new DateTime(2019, 3, 1), 42m, 42.62m, 43.31m, 41.38m, 7631700),
            new StockDataPoint(new DateTime(2019, 4, 1), 42.25m, 43.06m, 43.31m, 41.12m, 4922200)
        };

        StockChartProduct2Data = new List<StockDataPoint>()
    {
            new StockDataPoint(new DateTime(2019, 1, 1), 39m, 38m, 44m, 37m, 26320),
            new StockDataPoint(new DateTime(2019, 2, 1), 37m, 38m, 41m, 40m, 35847),
            new StockDataPoint(new DateTime(2019, 3, 1), 42m, 43m, 45m, 41m, 76317),
            new StockDataPoint(new DateTime(2019, 4, 1), 40m, 42m, 43m, 42m, 49222)
        };

        await Task.FromResult(StockChartProduct1Data);
        await Task.FromResult(StockChartProduct2Data);
    }

    public class StockDataPoint
    {
        public StockDataPoint() { }

        public StockDataPoint(DateTime date, decimal open, decimal close, decimal high, decimal low, int volume)
        {
            Date = date;
            Open = open;
            Close = close;
            High = high;
            Low = low;
            Volume = volume;
        }
        public DateTime Date { get; set; }

        public decimal Open { get; set; }

        public decimal Close { get; set; }

        public decimal High { get; set; }

        public decimal Low { get; set; }

        public int Volume { get; set; }
    }
}
The result from the code snippet above
Navigator Settings
The Navigator is defined closely to the way the charts are. As such you can use the nested tags settings to apply different customizations.
To programmatically set a time interval to the Navigator upon initialization use the From and To parameters of the <StockChartNavigatorSelect> and pass valid DateTime values according to your data.
To control whether the Navigator renders below or on top of the Stock Chart, set the Position parameter to a member of the StockChartNavigatorPosition enum.
You can control from which side (or both) the data navigation with shorten the time interval when the users cursor is located inside Navigator and is using the mouse wheel. To set it use the Zoom parameter of the <StockChartNavigatorSelectMousewheel>, child of <StockChartNavigatorSelect> to a member of the ChartMousewheelZoom enum:
ChartMousewheelZoom.LeftChartMousewheelZoom.RightChartMousewheelZoom.Both
Common settings for the Navigator
@* This example shows how to set a specific range of the Navigation upon initialization, allow the slider to be from both sides on mouse wheel rotation and customize the labels *@

<TelerikStockChart Width="750px"
                   Height="450px"
                   DateField="@nameof(StockDataPoint.Date)">

    <StockChartNavigator Position="@StockChartNavigatorPosition.Top">

        <StockChartNavigatorCategoryAxis>
            <StockChartNavigatorCategoryAxisLabels Color="#008B8B" Step="2">
            </StockChartNavigatorCategoryAxisLabels>
        </StockChartNavigatorCategoryAxis>

        <StockChartNavigatorSeriesItems>
            <StockChartNavigatorSeries Type="StockChartSeriesType.Line"
                                       Name="Product 1"
                                       Data="@StockChartProduct1Data"
                                       Field="@nameof(StockDataPoint.Open)"
                                       CategoryField="@nameof(StockDataPoint.Date)">
            </StockChartNavigatorSeries>

            <StockChartNavigatorSeries Type="StockChartSeriesType.Line"
                                       Name="Product 2"
                                       Data="@StockChartProduct2Data"
                                       Field="@nameof(StockDataPoint.Open)"
                                       CategoryField="@nameof(StockDataPoint.Date)">
            </StockChartNavigatorSeries>
        </StockChartNavigatorSeriesItems>

        <StockChartNavigatorSelect From="@(StockChartProduct1Data.FirstOrDefault().Date)" To="@(StockChartProduct1Data[2].Date)">
            <StockChartNavigatorSelectMousewheel Zoom="@ChartMousewheelZoom.Left" />
        </StockChartNavigatorSelect>
        <StockChartNavigatorHint Visible="true" Format="From {0:d} To: {1:d}" />

    </StockChartNavigator>

    <StockChartCategoryAxes>
        <StockChartCategoryAxis BaseUnit="@ChartCategoryAxisBaseUnit.Months"></StockChartCategoryAxis>
    </StockChartCategoryAxes>

    <StockChartSeriesItems>
        <StockChartSeries Type="StockChartSeriesType.Candlestick"
                          Name="Product 1"
                          Data="@StockChartProduct1Data"
                          OpenField="@nameof(StockDataPoint.Open)"
                          CloseField="@nameof(StockDataPoint.Close)"
                          HighField="@nameof(StockDataPoint.High)"
                          LowField="@nameof(StockDataPoint.Low)">
            <StockChartSeriesTooltip Visible="false"></StockChartSeriesTooltip>
        </StockChartSeries>

        <StockChartSeries Type="StockChartSeriesType.Candlestick"
                          Name="Product 2"
                          Data="@StockChartProduct2Data"
                          OpenField="@nameof(StockDataPoint.Open)"
                          CloseField="@nameof(StockDataPoint.Close)"
                          HighField="@nameof(StockDataPoint.High)"
                          LowField="@nameof(StockDataPoint.Low)">
            <StockChartSeriesTooltip Visible="false"></StockChartSeriesTooltip>
        </StockChartSeries>
    </StockChartSeriesItems>

</TelerikStockChart>

@code {
    public List<StockDataPoint> StockChartProduct1Data { get; set; }
    public List<StockDataPoint> StockChartProduct2Data { get; set; }

    protected override async Task OnInitializedAsync()
    {
        await GenerateChartData();
    }

    public async Task GenerateChartData()
    {
        StockChartProduct1Data = new List<StockDataPoint>()
        {
            new StockDataPoint(new DateTime(2019, 1, 1), 41.62m, 40.12m, 41.69m, 39.81m, 2632000),
            new StockDataPoint(new DateTime(2019, 2, 1), 39.88m, 40.12m, 41.12m, 39.75m, 3584700),
            new StockDataPoint(new DateTime(2019, 3, 1), 42m, 42.62m, 43.31m, 41.38m, 7631700),
            new StockDataPoint(new DateTime(2019, 4, 1), 42.25m, 43.06m, 43.31m, 41.12m, 4922200)
        };

        StockChartProduct2Data = new List<StockDataPoint>()
        {
            new StockDataPoint(new DateTime(2019, 1, 1), 39m, 38m, 44m, 37m, 26320),
            new StockDataPoint(new DateTime(2019, 2, 1), 37m, 38m, 41m, 40m, 35847),
            new StockDataPoint(new DateTime(2019, 3, 1), 42m, 43m, 45m, 41m, 76317),
            new StockDataPoint(new DateTime(2019, 4, 1), 40m, 42m, 43m, 42m, 49222)
        };

        await Task.FromResult(StockChartProduct1Data);
        await Task.FromResult(StockChartProduct2Data);
    }

    public class StockDataPoint
    {
        public StockDataPoint() { }

        public StockDataPoint(DateTime date, decimal open, decimal close, decimal high, decimal low, int volume)
        {
            Date = date;
            Open = open;
            Close = close;
            High = high;
            Low = low;
            Volume = volume;
        }
        public DateTime Date { get; set; }

        public decimal Open { get; set; }

        public decimal Close { get; set; }

        public decimal High { get; set; }

        public decimal Low { get; set; }

        public int Volume { get; set; }
    }
}
The result from the code snippet above